Multiple Choice
Suppose the table shows the average price of certain produce, in cents per pound, for selected months and years. Locate all critical points in the table and identify each point as a relative maximum point, relative minimum point, or a saddle point. 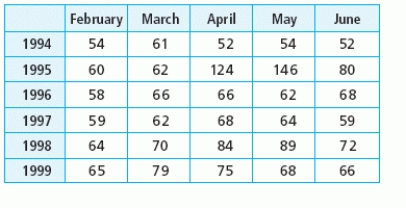
A) relative maximum point(s) : (May 1995) ; (May 1998)
Relative minimum point(s) : (May1996)
Saddle point(s) : (March 1996)
B) relative maximum point(s) (May 1995)
Relative minimum point(s) : (April 1994) and (June 1994)
Saddle point(s) : (March 1996)
C) relative maximum point(s) : (May 1995) ; (May 1998) ; (March 1999)
Relative minimum point(s) : (February 1994) ; (April 1995) ; (June 1994) ; (May 1996) ; (February 1997) ; (June 1997)
Saddle point(s) : (March 1994) ; (May 1994) ; (February 1995) ; (June 1995) ; (March 1996) ; (June 1998)
D) relative maximum point(s) : (May 1995)
Relative minimum point(s) : (April 1994) and (June 1994)
Saddle point(s) : (March 1994) ; (May 1994) ; (February 1995) ; (June 1995) ; (March 1996) ; (June 1998)
E) none of these
Correct Answer:

Verified
Correct Answer:
Verified
Q2: The consistometer table gives the consistency of
Q3: The number of animal experiments in a
Q4: The table below gives the number of
Q5: Identify the optimal point as either a
Q6: The table below gives the number of
Q8: Before technology was available to fit many
Q9: The figures show a contour graph for
Q10: A travel agency offers spring-break cruise packages.
Q11: A small percent of homes in an
Q12: Suppose that <img src="https://d2lvgg3v3hfg70.cloudfront.net/TB6775/.jpg" alt="Suppose that