Multiple Choice
Before technology was available to fit many kinds of models to data, researchers and others were restricted to using linear models. Because exponential data are common in many fields of study, it has always been important to be able to fit an exponential model to data. Consider the table showing past and predicted populations for a region. Change the data so that they represent the year and natural log of the population. Use the method of least squares to find the best fitting linear model for the changed data where x represents the year. You should keep the data in the form  and should not round the values until the final calculation. Give your coefficients to four decimal places.
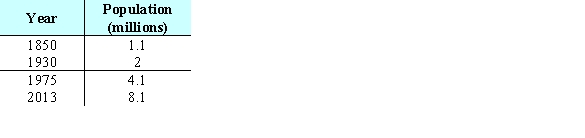
A) 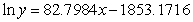
B) 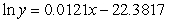
C) 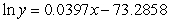
D) 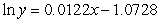
E) 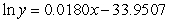
Correct Answer:

Verified
Correct Answer:
Verified
Q3: The number of animal experiments in a
Q4: The table below gives the number of
Q5: Identify the optimal point as either a
Q6: The table below gives the number of
Q7: Suppose the table shows the average price
Q9: The figures show a contour graph for
Q10: A travel agency offers spring-break cruise packages.
Q11: A small percent of homes in an
Q12: Suppose that <img src="https://d2lvgg3v3hfg70.cloudfront.net/TB6775/.jpg" alt="Suppose that
Q13: A factory makes 7-mm aluminum ball bearings.