Exam 19: Behavioral Economics
Exam 1: Preliminaries78 Questions
Exam 2: The Basics of Supply and Demand139 Questions
Exam 3: Consumer Behavior134 Questions
Exam 4: Individual and Market Demand131 Questions
Exam 5: Uncertainty and Consumer Behavior150 Questions
Exam 6: Production125 Questions
Exam 7: The Cost of Production178 Questions
Exam 8: Profit Maximization and Competitive Supply164 Questions
Exam 9: The Analysis of Competitive Markets183 Questions
Exam 10: Market Power: Monopoly and Monopsony158 Questions
Exam 11: Pricing With Market Power130 Questions
Exam 12: Monopolistic Competition and Oligopoly120 Questions
Exam 13: Game Theory and Competitive Strategy150 Questions
Exam 14: Markets for Factor Inputs134 Questions
Exam 15: Investment, Time, and Capital Markets153 Questions
Exam 16: General Equilibrium and Economic Efficiency126 Questions
Exam 17: Markets With Asymmetric Information133 Questions
Exam 18: Externalities and Public Goods131 Questions
Exam 19: Behavioral Economics101 Questions
Select questions type
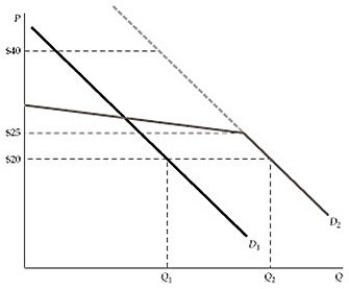 Figure 19.2.1
-Refer to Figure 19.2.1 above. Due to the perceived fairness of price increases during a snow storm, the demand curve:
Figure 19.2.1
-Refer to Figure 19.2.1 above. Due to the perceived fairness of price increases during a snow storm, the demand curve:
Free
(Multiple Choice)
4.8/5  (31)
(31)
Correct Answer: Verified
A
In understanding the concept of anchoring, which two factors play an essential role?
Free
(Multiple Choice)
4.8/5 (43)
Correct Answer:Verified
D
In the efficiency wage theory of labor, an increase in wages is justified by a resulting:
Free
(Multiple Choice)
4.7/5 (32)
Correct Answer:Verified
C
The natural human tendency to underestimate the likelihood of a catastrophic medical emergency is a case of:
(Multiple Choice)
4.8/5 (36)
Which of the following is more important in sending a signal of the value of a good to consumers?
(Multiple Choice)
4.9/5 (36)
Figure 19.2.1
-Refer to Figure 19.2.1 above. The price level of $40 illustrates the fact that:
(Multiple Choice)
4.9/5 (41)
Figure 19.2.1
-Refer to Figure 19.2.1 above. Consumers would not buy a shovel when they perceive price gauging. Which demand or portion of a demand curve best reflects that statement?
(Multiple Choice)
4.8/5 (36)
In real terms, housing prices after the burst of the housing bubble fell on average by:
(Multiple Choice)
4.9/5 (23)
It is possible to reduce emissions without intervention, only if:
(Multiple Choice)
4.9/5 (37)
When the probability of an event is very, very small, individuals tend to:
(Multiple Choice)
4.8/5 (36)
After the bubble in housing prices in 2008 burst, we learned that:
(Multiple Choice)
5.0/5 (30)
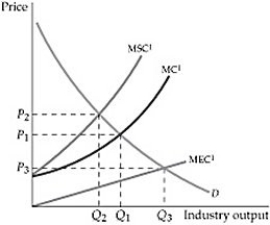 Figure 19.5.1
-Refer to Figure 19.5.1 above. If unregulated, the industry will produce:
Figure 19.5.1
-Refer to Figure 19.5.1 above. If unregulated, the industry will produce:
(Multiple Choice)
4.9/5 (38)
In the classroom experiment where a mug is bought and sold,
(Multiple Choice)
4.9/5 (30)
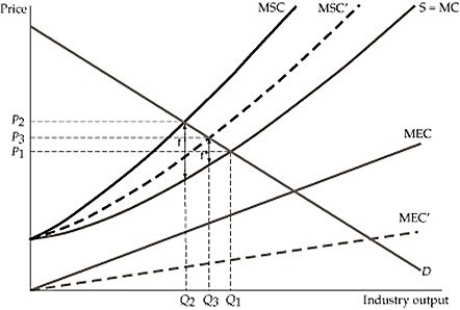 Figure 19.5.2
-Refer to Figure 19.5.2 above. Once consumers and firms develop awareness of the benefits of reducing energy consumption,
Figure 19.5.2
-Refer to Figure 19.5.2 above. Once consumers and firms develop awareness of the benefits of reducing energy consumption,
(Multiple Choice)
4.8/5 (36)
Which of the following statements best describe the textbook narrative on moral persuasion?
(Multiple Choice)
4.9/5 (44)
Figure 19.2.1
-Refer to Figure 19.2.1 above. During a snow storm,
(Multiple Choice)
4.7/5 (34)
Figure 19.2.1
-Refer to Figure 19.2.1 above. Consumers understand why the price of shovels would increase somewhat during a snow storm and would be willing to buy at higher prices. Which demand or portion of a demand curve best reflects that statement?
(Multiple Choice)
4.8/5 (35)
In the experiment that observes how people become less prone to violate a local ordinance on littering, the factor that changed their behavior was, predominantly:
(Multiple Choice)
4.8/5 (27)
Filters
- Essay(0)
- Multiple Choice(0)
- Short Answer(0)
- True False(0)
- Matching(0)