Exam 8: Profit Maximization and Competitive Supply
Exam 1: Preliminaries78 Questions
Exam 2: The Basics of Supply and Demand139 Questions
Exam 3: Consumer Behavior134 Questions
Exam 4: Individual and Market Demand131 Questions
Exam 5: Uncertainty and Consumer Behavior150 Questions
Exam 6: Production125 Questions
Exam 7: The Cost of Production178 Questions
Exam 8: Profit Maximization and Competitive Supply164 Questions
Exam 9: The Analysis of Competitive Markets183 Questions
Exam 10: Market Power: Monopoly and Monopsony158 Questions
Exam 11: Pricing With Market Power130 Questions
Exam 12: Monopolistic Competition and Oligopoly120 Questions
Exam 13: Game Theory and Competitive Strategy150 Questions
Exam 14: Markets for Factor Inputs134 Questions
Exam 15: Investment, Time, and Capital Markets153 Questions
Exam 16: General Equilibrium and Economic Efficiency126 Questions
Exam 17: Markets With Asymmetric Information133 Questions
Exam 18: Externalities and Public Goods131 Questions
Exam 19: Behavioral Economics101 Questions
Select questions type
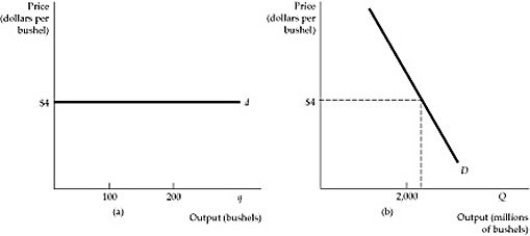 Figure 8.3.2
-Refer to Figure 8.3.2 above. The demand of a price taker is illustrated:
Figure 8.3.2
-Refer to Figure 8.3.2 above. The demand of a price taker is illustrated:
Free
(Multiple Choice)
4.8/5  (41)
(41)
Correct Answer: Verified
A
The amount of output that a firm decides to sell has no effect on the market price in a competitive industry because:
Free
(Multiple Choice)
4.9/5 (37)
Correct Answer:Verified
C
A competitive market is made up of 100 identical firms. Each firm has a short-run marginal cost function as follows:
MC = 5 + 0.5Q,
where Q represents units of output per unit of time. The firm's average variable cost curve intersects the marginal cost at a vertical distance of 10 above the horizontal axis. Determine the market short-run supply curve. Calculate the price that would make 2,000 units forthcoming per time period. Note the minimum price at which any quantity would be placed on the market.
(Essay)
4.8/5 (28)
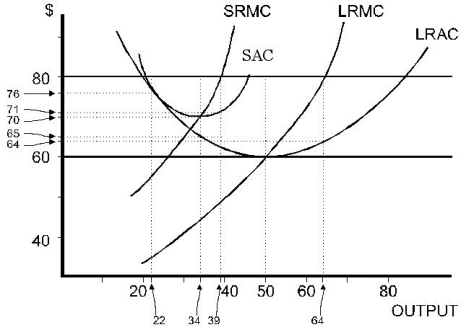 Figure 8.7.3
-Refer to Figure 8.7.3 above. As the competitive industry, not just the firm in question, moves toward long-run equilibrium, what will the price be?
Figure 8.7.3
-Refer to Figure 8.7.3 above. As the competitive industry, not just the firm in question, moves toward long-run equilibrium, what will the price be?
(Multiple Choice)
4.9/5 (38)
In the local cotton market, there are 1,000 producers that have identical short-run cost functions. They are: 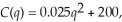 where q is the number of bales produced each period. The short-run marginal cost function for each producer is: MC(q) = 0.05q. If the local cotton market is perfectly competitive, what is each cotton producer's short-run supply curve? Derive the local market supply curve of cotton.
(Essay)
4.9/5 (36)
Because of the relationship between a perfectly competitive firm's demand curve and its marginal revenue curve, the profit maximization condition for the firm can be written as:
(Multiple Choice)
4.8/5 (38)
Scenario 8.2:
Yachts are produced by a perfectly competitive industry in Dystopia. Industry output (Q) is currently 30,000 yachts per year. The government, in an attempt to raise revenue, places a $20,000 tax on each yacht. Demand is highly, but not perfectly, elastic.
-Refer to Scenario 8.2. The result of the tax in the long run will be that:
(Multiple Choice)
4.9/5 (30)
The authors explain that a firm earning a zero economic profit in the long run has earned a competitive return on their investment. What do they mean by "competitive" return in this context?
(Multiple Choice)
4.8/5 (35)
Figure 8.7.3
-Refer to Figure 8.7.3 above. How much profit will the firm earn if price stays at $80?
(Multiple Choice)
4.9/5 (39)
The perfectly competitive firm's marginal revenue curve is:
(Multiple Choice)
4.8/5 (34)
Which of the following cases are examples of industries that have potentially increasing costs due to scarce inputs?
(Multiple Choice)
4.9/5 (29)
Suppose the market demand curve is perfectly elastic in an increasing-cost industry. If an output tax of t per unit is imposed on all producers of the good, what happens to the market equilibrium outcome?
(Multiple Choice)
4.9/5 (30)
If current output is less than the profit-maximizing output, which must be true?
(Multiple Choice)
4.9/5 (30)
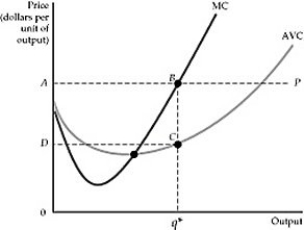 Figure 8.6.2
-Refer to Figure 8.6.2 above. Which area represents producer surplus in this figure?
Figure 8.6.2
-Refer to Figure 8.6.2 above. Which area represents producer surplus in this figure?
(Multiple Choice)
4.8/5 (34)
If current output is less than the profit-maximizing output, then the next unit produced
(Multiple Choice)
5.0/5 (40)
Filters
- Essay(0)
- Multiple Choice(0)
- Short Answer(0)
- True False(0)
- Matching(0)