Exam 17: Reading, Understanding, and Creating Graphs
Exam 1: The Central Idea155 Questions
Exam 2: Observing and Explaining the Economy108 Questions
Exam 3: The Supply and Demand Model170 Questions
Exam 4: Subtleties of the Supply and Demand Model: Price Floors, Price Ceilings, and Elasticity179 Questions
Exam 5: The Demand Curve and the Behavior of Consumers136 Questions
Exam 6: The Supply Curve and the Behavior of Firms182 Questions
Exam 7: The Interaction of People in Markets158 Questions
Exam 8: Costs and the Changes at Firms Over Time172 Questions
Exam 9: The Rise and Fall of Industries139 Questions
Exam 10: Monopoly182 Questions
Exam 11: Product Differentiation, Monopolistic Competition, and Oligopoly169 Questions
Exam 12: Antitrust Policy and Regulation152 Questions
Exam 13: Labor Markets179 Questions
Exam 14: Taxes, Transfers, and Income Distribution180 Questions
Exam 15: Public Goods, Externalities, and Government Behavior201 Questions
Exam 16: Capital and Financial Markets174 Questions
Exam 17: Reading, Understanding, and Creating Graphs35 Questions
Exam 18: Consumer Theory With Indifference Curves39 Questions
Exam 19: Producer Theory With Isoquants19 Questions
Select questions type
Exhibit 2A-5 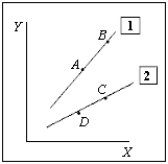 -Refer to Exhibit 2A-5. The movement from C to B is called a
(Multiple Choice)
4.8/5  (37)
(37)
Consider a ratio for the total number of miles traveled by car divided by the total number of drivers.

(Essay)
4.9/5 (37)
Refer to the table below. Analyze the data on the number of meals served at small and large restaurants. The number of meals served will vary with the number of cooks employed at the restaurant. 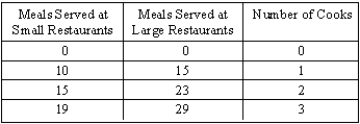

(Essay)
4.9/5 (33)
The table below shows the inflation rate for the period 2005 through 2010. Suppose you wanted to show that there was not much variation in the inflation rate over this period. How would you represent this table in a graph? Suppose you wanted to show that there was a large amount of variation during this period. How would you represent this table in a graph? 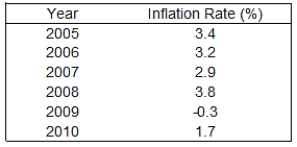
(Essay)
4.9/5 (42)
Exhibit 2A-5
-Refer to Exhibit 2A-5. The movement from A to B is called a
(Multiple Choice)
4.7/5 (35)
Graph the relationship between X and Y such that the relationship between X and Y is linear and positive.

(Essay)
4.9/5 (37)
Exhibit 2A-2  -An inverse relationship between two variables indicates a
(Multiple Choice)
4.9/5 (32)
Consider a straight line with a slope of +1 that intersects the origin. It dissects the positive X-Y quadrant. Select any point on the line. What must be true about the distance between the origin and the X coordinate and between the origin and the Y coordinate?
(Short Answer)
4.9/5 (32)
Exhibit 2A-2
-The type of chart shown in Exhibit 2A-2 is referred to as a
(Multiple Choice)
4.7/5 (30)
Filters
- Essay(0)
- Multiple Choice(0)
- Short Answer(0)
- True False(0)
- Matching(0)