Exam 14: Simulation Modeling
Exam 1: Introduction to Quantitative Analysis63 Questions
Exam 2: Probability Concepts and Applications145 Questions
Exam 3: Decision Analysis119 Questions
Exam 4: Regression Models120 Questions
Exam 5: Forecasting101 Questions
Exam 6: Inventory Control Models113 Questions
Exam 7: Linear Programming Models: Graphical and Computer Methods100 Questions
Exam 8: Linear Programming Applications96 Questions
Exam 9: Transportation and Assignment Models80 Questions
Exam 10: Integer Programming, Goal Programming, and Nonlinear Programming88 Questions
Exam 11: Network Models86 Questions
Exam 12: Project Management123 Questions
Exam 13: Waiting Lines and Queuing Theory Models133 Questions
Exam 14: Simulation Modeling68 Questions
Exam 15: Markov Analysis78 Questions
Exam 16: Statistical Quality Control87 Questions
Select questions type
To "simulate" is to try to duplicate the features, appearance, and characteristics of a real system.
(True/False)
4.9/5  (41)
(41)
Simulation models are designed to generate optimal solutions, which can then be applied to real-world situations.
(True/False)
4.8/5 (43)
Table 14-3
A pawn shop in Arlington, Texas, has a drive-through window to better serve customers. The following tables provide information about the time between arrivals and the service times required at the window on a particularly busy day of the week. All times are in minutes. 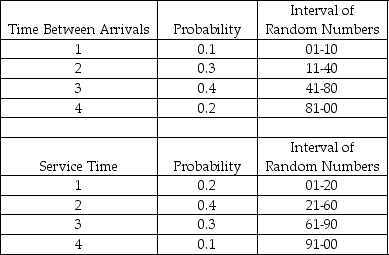 The first random number generated for arrivals is used to tell when the first customer arrives after opening.
-According to Table 14-3, the time between successive arrivals is 1, 2, 3, or 4 minutes. The store opens at 8:00 a.m., and random numbers are used to generate arrivals and service times. The first 3 random numbers to generate arrivals are 09, 89, and 26. What time does the third customer arrive?
The first random number generated for arrivals is used to tell when the first customer arrives after opening.
-According to Table 14-3, the time between successive arrivals is 1, 2, 3, or 4 minutes. The store opens at 8:00 a.m., and random numbers are used to generate arrivals and service times. The first 3 random numbers to generate arrivals are 09, 89, and 26. What time does the third customer arrive?
(Multiple Choice)
4.8/5 (32)
A computer help desk receives new daily customer arrivals according to the following probability distribution: 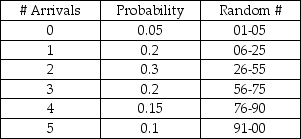 The number of customers that the help desk has the capability to serve per day is based on the following probability distribution:
 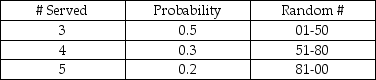 If the number of arrivals exceeds the # served capability, the customers will receive top priority the next day. The random numbers drawn for a 5-day simulation are as follows:
 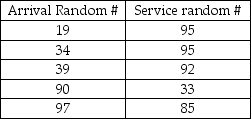 What will the average number of delays be for the 5 day simulation?
(Essay)
4.8/5 (47)
Table 14-3
A pawn shop in Arlington, Texas, has a drive-through window to better serve customers. The following tables provide information about the time between arrivals and the service times required at the window on a particularly busy day of the week. All times are in minutes. The first random number generated for arrivals is used to tell when the first customer arrives after opening.
-According to Table 14-3, the time between successive arrivals is 1, 2, 3, or 4 minutes. The store opens at 8:00 a.m., and random numbers are used to generate arrivals and service times. The first two random numbers for arrivals are 95 and 08. The first two random numbers for service times are 92 and 18. At what time does the second customer finish transacting business?
(Multiple Choice)
4.8/5 (39)
Simulation models may contain both deterministic and probabilistic variables.
(True/False)
4.8/5 (30)
Simulation of a business or process is generally performed by building a mathematical model to represent the process or system.
(True/False)
4.8/5 (39)
Simulation models are limited to using standard probability distributions such as Poisson, exponential, normal, etc.
(True/False)
4.9/5 (36)
Table 14-4 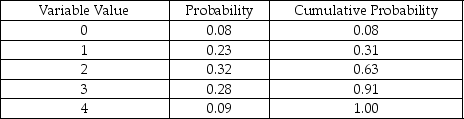
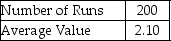 -According to Table 14-4, which presents a summary of the Monte Carlo output from a simulation of 200 runs, there are 5 possible values for the variable of concern. If this variable represents the number of machine breakdowns during a day, what is the probability that the number of breakdowns is more than 4?
(Multiple Choice)
5.0/5 (36)
Table 14-2
A pharmacy is considering hiring another pharmacist to better serve customers. To help analyze this situation, records are kept to determine how many customers will arrive in any 10-minute interval. Based on 100 ten-minute intervals, the following probability distribution has been developed and random numbers assigned to each event. 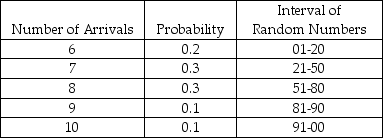 -According to Table 14-2, the number of arrivals in any 10-minute period is between 6 and 10 inclusive. Suppose the next 3 random numbers were 02, 81, and 18. These numbers are used to simulate arrivals into the pharmacy. What would the average number of arrivals per 10-minute period be based on this set of occurrences?
(Multiple Choice)
4.8/5 (29)
Table 14-2
A pharmacy is considering hiring another pharmacist to better serve customers. To help analyze this situation, records are kept to determine how many customers will arrive in any 10-minute interval. Based on 100 ten-minute intervals, the following probability distribution has been developed and random numbers assigned to each event.
-According to Table 14-2, the number of arrivals in any 10-minute period is between 6 and 10, inclusive. Suppose the next three random numbers were 18, 89, and 67, and these were used to simulate arrivals in the next three 10-minute intervals. How many customers would have arrived during this 30-minute time period?
(Multiple Choice)
4.7/5 (37)
Table 14-3
A pawn shop in Arlington, Texas, has a drive-through window to better serve customers. The following tables provide information about the time between arrivals and the service times required at the window on a particularly busy day of the week. All times are in minutes. The first random number generated for arrivals is used to tell when the first customer arrives after opening.
-According to Table 14-3, the time between successive arrivals is 1, 2, 3, or 4 minutes. The store opens at 8:00 a.m., and random numbers are used to generate arrivals and service times. The first random number to generate an arrival is 39, while the first service time is generated by the random number 94. What time would the first customer finish transacting business?
(Multiple Choice)
4.8/5 (43)
There are three categories of simulation models: Monte Carlo, operational gaming, and systems simulation.
(True/False)
4.9/5 (36)
The demand for refrigerators at an appliance store adheres to the following probability distribution: 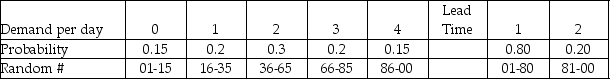 The store orders 4 refrigerators per day to have in stock to meet demand. They are trying to maintain low inventory levels. The holding cost is $5/unit/day. The ordering cost is $20 per order. The lost sale cost is $10/unit. A simulation is to be developed to estimate the average daily inventory cost over 5 days. The table below shows the random numbers to be used for refrigerator demand and lead time on orders:
 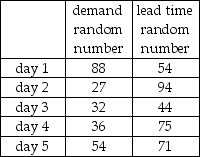 Assuming that beginning inventory is equal to 5 with no prior orders in transit, what is the overall average daily cost of inventory for the 5 days?
(Essay)
4.9/5 (34)
Simulation of maintenance problems can help management analyze various staffing strategies based on machine downtime and labor cost.
(True/False)
4.8/5 (40)
Consider the interval of random numbers presented below. The following random numbers have been generated: 99, 98, 26, 09, 49, 52, 33, 89, 21, 37. Simulate 10 hours of arrivals at this gas station. What is the average number of arrivals during this period? 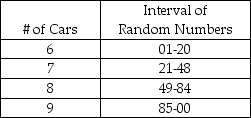
(Essay)
4.7/5 (37)
Customer arrivals adhere to the following probability distribution: 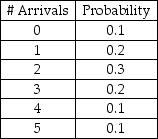 Create an appropriate table of interval of random numbers.
(Essay)
4.8/5 (35)
Operational gaming involves a single player competing with the computer simulated game.
(True/False)
4.8/5 (40)
Filters
- Essay(0)
- Multiple Choice(0)
- Short Answer(0)
- True False(0)
- Matching(0)