Exam 15: Statistical Quality Control
Exam 1: Introduction to Quantitative Analysis71 Questions
Exam 2: Probability Concepts and Applications157 Questions
Exam 3: Decision Analysis128 Questions
Exam 4: Regression Models133 Questions
Exam 5: Forecasting111 Questions
Exam 6: Inventory Control Models123 Questions
Exam 7: Linear Programming Models: Graphical and Computer Methods110 Questions
Exam 8: Linear Programming Applications105 Questions
Exam 9: Transportation,assignment,and Network Models98 Questions
Exam 10: Integer Programming,goal Programming,and Nonlinear Programming98 Questions
Exam 11: Project Management134 Questions
Exam 12: Waiting Lines and Queuing Theory Models145 Questions
Exam 13: Simulation Modeling79 Questions
Exam 14: Markov Analysis86 Questions
Exam 15: Statistical Quality Control98 Questions
Exam 16: Analytic Hierarchy Process53 Questions
Exam 17: Dynamic Programming67 Questions
Exam 18: Decision Theory and the Normal Distribution50 Questions
Exam 19: Game Theory47 Questions
Exam 20: Mathematical Tools: Determinants and Matrices99 Questions
Exam 21: Calculus-Based Optimization24 Questions
Exam 22: Linear Programming: The Simplex Method100 Questions
Exam 23: Transportation, Assignment, and Network Algorithms111 Questions
Select questions type
The chart one might use to monitor the number of defects per roll of carpet is a ________.
(Essay)
4.7/5  (40)
(40)
Bags of pretzels are sampled to ensure proper weight.The overall average for the samples is 9 ounces.Each sample contains 25 bags.The standard deviation is estimated to be 3 ounces.The upper control chart limit (for 99.7% confidence)for the average would be ________ ounces.
(Multiple Choice)
4.8/5 (35)
________ refers to a quality emphasis that encompasses the entire organization,from supplier to customer.
(Essay)
4.8/5 (36)
A p-chart is based on which of the following probability distributions?
(Multiple Choice)
4.9/5 (36)
A(n)________ chart is appropriate to monitor the number of needle sticks incurred inadvertently by nurses who are administering medications.
(Essay)
4.9/5 (37)
If all of the control points on a control chart lie between the UCL and the LCL,the process is always in control.
(True/False)
4.9/5 (40)
If we wish to monitor the number of defects on a page in a printing process,the distribution we base our statistics on is the ________ distribution.
(Essay)
4.8/5 (36)
________ are graphs that show upper and lower limits for the process we want to control.
(Essay)
4.8/5 (38)
A c-chart would be appropriate to monitor the number of weld defects on the steel plates of a ship's hull.
(True/False)
4.8/5 (36)
Which of the following statements is FALSE regarding control charts?
(Multiple Choice)
4.8/5 (41)
A(n)________ chart is appropriate to monitor the percent defective of a production process.
(Essay)
4.8/5 (46)
If we wish to monitor the average diameter of the hula hoops we are producing,the distribution we base our statistics on is the ________ distribution.
(Essay)
4.8/5 (41)
The U.S.government awards for quality achievement are called the Malcolm Baldrige National Quality Awards.
(True/False)
4.8/5 (42)
A p-chart could be used to monitor the average weight of cereal boxes.
(True/False)
4.8/5 (39)
Table 15-1 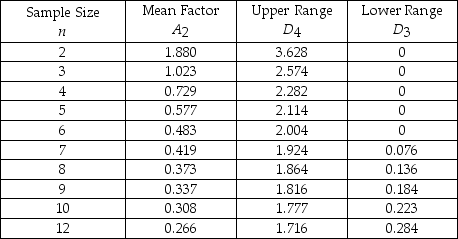 -Refer to Table 15-1.Bags of chocolate candy are sampled to ensure proper weight.The overall average for the samples is 36 ounces.Each sample contains eight bags.The average range is 1.3 ounces.The lower control chart limit for the sample averages would be
(Multiple Choice)
5.0/5 (35)
Table 15-2
Given the sample results (100 units in each sample): 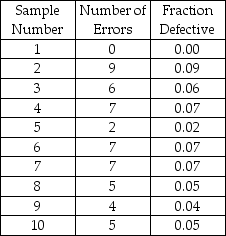 -Based on Table 15-2,find the 95.5% lower limit of the appropriate p-chart.
(Multiple Choice)
4.9/5 (42)
Which of the following control charts is/are for variables?
(Multiple Choice)
4.9/5 (36)
Filters
- Essay(0)
- Multiple Choice(0)
- Short Answer(0)
- True False(0)
- Matching(0)