Exam 15: Statistical Quality Control
Exam 1: Introduction to Quantitative Analysis71 Questions
Exam 2: Probability Concepts and Applications157 Questions
Exam 3: Decision Analysis128 Questions
Exam 4: Regression Models133 Questions
Exam 5: Forecasting111 Questions
Exam 6: Inventory Control Models123 Questions
Exam 7: Linear Programming Models: Graphical and Computer Methods110 Questions
Exam 8: Linear Programming Applications105 Questions
Exam 9: Transportation,assignment,and Network Models98 Questions
Exam 10: Integer Programming,goal Programming,and Nonlinear Programming98 Questions
Exam 11: Project Management134 Questions
Exam 12: Waiting Lines and Queuing Theory Models145 Questions
Exam 13: Simulation Modeling79 Questions
Exam 14: Markov Analysis86 Questions
Exam 15: Statistical Quality Control98 Questions
Exam 16: Analytic Hierarchy Process53 Questions
Exam 17: Dynamic Programming67 Questions
Exam 18: Decision Theory and the Normal Distribution50 Questions
Exam 19: Game Theory47 Questions
Exam 20: Mathematical Tools: Determinants and Matrices99 Questions
Exam 21: Calculus-Based Optimization24 Questions
Exam 22: Linear Programming: The Simplex Method100 Questions
Exam 23: Transportation, Assignment, and Network Algorithms111 Questions
Select questions type
Table 15-1 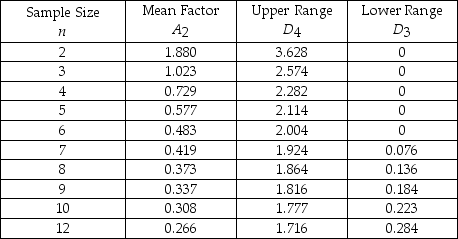 -Refer to Table 15-1.Bags of tea are sampled to ensure proper weight.The overall average for the samples is 8 ounces.Each sample contains 10 bags.The average range is 0.1 ounces.What is the lower limit of the sample averages chart?
(Multiple Choice)
4.9/5  (31)
(31)
Which of the following control charts is/are for attributes?
(Multiple Choice)
4.8/5 (36)
Explain the difference between control charts for variables and attributes.
(Essay)
4.9/5 (43)
If we are tracking quality of performance for a class of students,we should plot the individual grades on an x-bar chart,and the pass/fail result on a p-chart.
(True/False)
4.9/5 (41)
Which of the following is not a popular definition of quality?
(Multiple Choice)
4.8/5 (32)
For the problems which follow,match the following.
-Column 1: R-chart
Column 2: Range of variables
(Essay)
4.7/5 (34)
Table 15-2
Given the sample results (100 units in each sample): 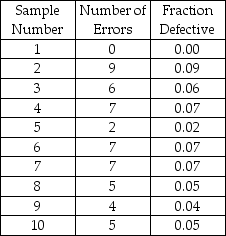 -A company has been receiving complaints about the attitude of some sales clerks.Over a 10-day period,the total number of complaints was 250.The company wishes to develop a control chart for the number of complaints.What would the lower control limit on the number of complaints per day be for a 3 sigma (99.7%)control chart?
(Multiple Choice)
4.9/5 (44)
Table 15-2
Given the sample results (100 units in each sample):
-A company has been receiving complaints about the attitude of some sales clerks.Over a 10-day period,the total number of complaints was 250.The company wishes to develop a control chart for the number of complaints.What would the upper control limit on the number of complaints per day be for a 2 sigma (95.5%)control chart?
(Multiple Choice)
4.9/5 (38)
The U.S.government award for quality achievement is called the ________.
(Essay)
4.7/5 (44)
A(n)________ chart is appropriate to monitor the weight of chocolate candy bars.
(Essay)
4.9/5 (35)
P-charts and c-charts are examples of control charts for variables.
(True/False)
4.8/5 (41)
Natural variation of a production process that follows a normal distribution is characterized by two parameters: ________ and ________.
(Essay)
4.7/5 (41)
Table 15-2
Given the sample results (100 units in each sample):
-A company has been receiving complaints about the attitude of some sales clerks.Over a 10-day period,the total number of complaints was 250.The company wishes to develop a control chart for the number of complaints.What would the lower control limit on the number of complaints per day be for a 2 sigma (95.5%)control chart?
(Multiple Choice)
4.8/5 (43)
For the problems which follow,match the following.
-Column 1: Control chart
Column 2: Graphical presentation of process data
(Essay)
4.9/5 (42)
For the problems which follow,match the following.
-Column 1: c-chart
Column 2: Count of attributes
(Essay)
4.9/5 (33)
When a process is in control,only ________ variations exist in the process.
(Essay)
4.9/5 (46)
Match the following.
-Column 1:  ± 3
± 3  Column 2: Control limits for a c-chart
(Essay)
4.7/5 (42)
Table 15-1
-Refer to Table 15-1.To guarantee that cans of soda are properly filled,some cans are sampled and the amounts measured.The overall average for the samples is 12 ounces.Each sample contains 10 cans.The average range is 0.4 ounces.The lower control chart limit for the sample averages would be
(Multiple Choice)
4.7/5 (40)
Filters
- Essay(0)
- Multiple Choice(0)
- Short Answer(0)
- True False(0)
- Matching(0)