Exam 15: Statistical Quality Control
Exam 1: Introduction to Quantitative Analysis71 Questions
Exam 2: Probability Concepts and Applications157 Questions
Exam 3: Decision Analysis128 Questions
Exam 4: Regression Models133 Questions
Exam 5: Forecasting111 Questions
Exam 6: Inventory Control Models123 Questions
Exam 7: Linear Programming Models: Graphical and Computer Methods110 Questions
Exam 8: Linear Programming Applications105 Questions
Exam 9: Transportation,assignment,and Network Models98 Questions
Exam 10: Integer Programming,goal Programming,and Nonlinear Programming98 Questions
Exam 11: Project Management134 Questions
Exam 12: Waiting Lines and Queuing Theory Models145 Questions
Exam 13: Simulation Modeling79 Questions
Exam 14: Markov Analysis86 Questions
Exam 15: Statistical Quality Control98 Questions
Exam 16: Analytic Hierarchy Process53 Questions
Exam 17: Dynamic Programming67 Questions
Exam 18: Decision Theory and the Normal Distribution50 Questions
Exam 19: Game Theory47 Questions
Exam 20: Mathematical Tools: Determinants and Matrices99 Questions
Exam 21: Calculus-Based Optimization24 Questions
Exam 22: Linear Programming: The Simplex Method100 Questions
Exam 23: Transportation, Assignment, and Network Algorithms111 Questions
Select questions type
An airline company tracks the number of lost bags that occur each day.This is best monitored by which of the following control charts?
(Multiple Choice)
4.8/5  (40)
(40)
Statistical process control uses regression and other forecasting tools to help control processes.
(True/False)
4.8/5 (32)
Table 15-2
Given the sample results (100 units in each sample): 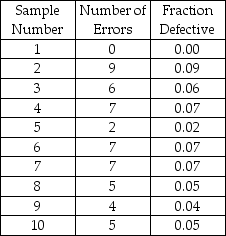 -A company has been receiving complaints about the attitude of some sales clerks.Over a 10-day period,the total number of complaints was 360.The company wishes to develop a control chart for the number of complaints.What would the upper control limit on the number of complaints per day be for a 3 sigma (99.7%)control chart?
(Multiple Choice)
4.8/5 (35)
A c-chart is based on which of the following probability distributions?
(Multiple Choice)
4.9/5 (37)
A local children's boutique specializes in formal wear for young girls.It has recently hired a new seamstress.To assure the dresses have standard sizes,twenty samples of each 12 dresses that were labeled 3T were sampled.The average length from shoulder to hemline measured 21 inches with a range of 0.5 inches.A sample has just been taken with the following lengths: 21.25,22.0,21.5,20.75,21.25,21.35,21.35,21.35,21.35,21.35,21.35,and 21.35.Is the new seamstress performing at an acceptable quality level?
(Essay)
4.9/5 (35)
A company believes a process monitored by an x-bar chart to be in control.When the most recent control point exceeded the UCL value by 20%,the company should
(Multiple Choice)
4.7/5 (38)
When a process is out of control,________ variations exist in the process.
(Essay)
4.9/5 (33)
Match the following.
-Column 1:  ± z σp
Column 2: Control limits for a p-chart
± z σp
Column 2: Control limits for a p-chart
(Essay)
4.9/5 (35)
The central limit theorem provides the statistical foundation for control charts.
(True/False)
4.9/5 (32)
A retail store charts the number of customer returns per day.Under normal conditions,the store expects 10 customer returns per day.During the past 10 days,the observed customer returns were as follows: 12,9,8,14,8,13,8,10,9,11.Using 99.7% control limits,is the process under control?
(Essay)
4.9/5 (33)
C-charts are used to analyze the proportion defective in a sample.
(True/False)
4.8/5 (40)
A plant manager is concerned with the variability of beer being filled in 12 oz.cans.The most appropriate control chart would be which of the following?
(Multiple Choice)
4.8/5 (37)
When receiving a shipment from a supplier,inspection must be done to check the fraction of defective products.This is best monitored by which of the following control charts?
(Multiple Choice)
4.9/5 (46)
A coffee dispenser is supposed to dispense coffee into an 8 o.z.cup.The average amount of coffee filled into the cup must be below 7.9.This is best monitored by which of the following control charts?
(Multiple Choice)
4.9/5 (33)
Technically,to achieve Six Sigma quality,there would have to be fewer than ________ defects per million opportunities.
(Essay)
4.8/5 (34)
For the problems which follow,match the following.
-Column 1: p-chart
Column 2: Fraction of attributes
(Essay)
4.9/5 (33)
Table 15-1 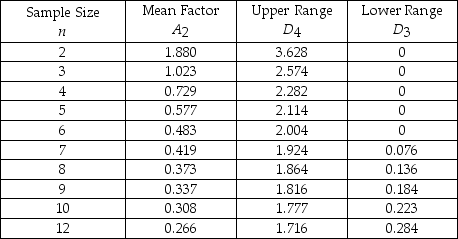 -Refer to Table 15-1.The average range of a process for packaging cereal is 1.1 ounces.If the sample size is 10,find the lower control chart limit for the range chart.
(Multiple Choice)
4.8/5 (39)
Filters
- Essay(0)
- Multiple Choice(0)
- Short Answer(0)
- True False(0)
- Matching(0)