Exam 17: A Roadmap for Analyzing Data
Exam 1: Defining and Collecting Data189 Questions
Exam 3: Numerical Descriptive Measures184 Questions
Exam 4: Basic Probability156 Questions
Exam 5: Discrete Probability Distributions218 Questions
Exam 6: The Normal Distribution and Other Continuous Distributions189 Questions
Exam 7: Sampling Distributions127 Questions
Exam 8: Confidence Interval Estimation196 Questions
Exam 9: Fundamentals of Hypothesis Testing: One-Sample Tests170 Questions
Exam 10: Two-Sample Tests210 Questions
Exam 11: Analysis of Variance130 Questions
Exam 12: Chi-Square Tests and Nonparametric Tests175 Questions
Exam 13: Simple Linear Regression213 Questions
Exam 14: Introduction to Multiple Regression337 Questions
Exam 15: Multiple Regression Model Building96 Questions
Exam 16: Time-Series Forecasting165 Questions
Exam 17: A Roadmap for Analyzing Data303 Questions
Exam 18: Statistical Applications in Quality Management130 Questions
Exam 19: Decision Making126 Questions
Exam 20: Index Numbers44 Questions
Exam 21: Chi-Square Tests for the Variance or Standard Deviation11 Questions
Exam 22: Mcnemar Test for the Difference Between Two Proportions Related Samples15 Questions
Exam 25: The Analysis of Means Anom2 Questions
Exam 23: The Analysis of Proportions Anop3 Questions
Exam 24: The Randomized Block Design85 Questions
Exam 26: The Power of a Test41 Questions
Exam 27: Estimation and Sample Size Determination for Finite Populations13 Questions
Exam 28: Application of Confidence Interval Estimation in Auditing13 Questions
Exam 29: Sampling From Finite Populations20 Questions
Exam 30: The Normal Approximation to the Binomial Distribution27 Questions
Exam 31: Counting Rules14 Questions
Exam 32: Lets Get Started Big Things to Learn First33 Questions
Select questions type
TABLE 17-3
A financial analyst wanted to examine the relationship between salary (in $1,000)and 4 variables: age (X1 = Age),experience in the field (X2 = Exper),number of degrees (X3 = Degrees),and number of previous jobs in the field (X4 = Prevjobs).He took a sample of 20 employees and obtained the following Microsoft Excel output:
SUMMARY OUTPUT
Regression Statistics 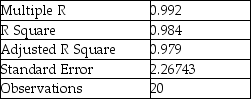 ANOVA
ANOVA 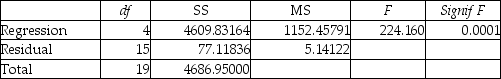
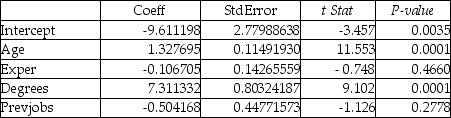 -Referring to Table 17-3,the analyst wants to use a t test to test for the significance of the coefficient of X3.For a level of significance of 0.01,the critical values of the test are ________.
(Short Answer)
4.8/5  (36)
(36)
An airline wants to select a computer software package for its reservation system.Four software packages (1,2,3,and 4)are commercially available.An experiment is set up in which each package is used to make reservations for 5 randomly selected weeks and data on the number of passengers that are bumped over a month are collected.(A total of 20 weeks was included in the experiment.)The variance on the number of passengers that are bumped is found to be roughly the same for the 4 packages.Which of the following tests will be the most appropriate to find out if the mean number of passengers being bumped over a month is the same across the 4 packages?
(Multiple Choice)
4.9/5 (41)
TABLE 17-6
A weight-loss clinic wants to use regression analysis to build a model for weight loss of a client (measured in pounds).Two variables thought to affect weight loss are client's length of time on the weight-loss program and time of session.These variables are described below:
Y = Weight loss (in pounds)
X1 = Length of time in weight-loss program (in months)
X2 = 1 if morning session,0 if not
X3 = 1 if afternoon session,0 if not (Base level = evening session)
Data for 12 clients on a weight-loss program at the clinic were collected and used to fit the interaction model:
Y = β0 + β1X1 + β2X2 + β3X3 + β4X1X2 + β5X1X3 + ε
Partial output from Microsoft Excel follows:
Regression Statistics 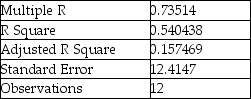 ANOVA
F = 5.41118 Significance F = 0.040201
ANOVA
F = 5.41118 Significance F = 0.040201 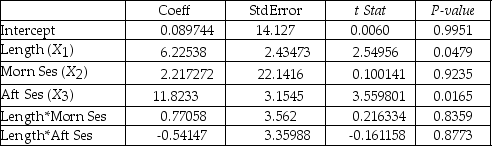 -Referring to Table 17-6,what null hypothesis would you test to determine whether the slope of the linear relationship between weight loss (Y)and time in the program (X1)varies according to time of session?
(Multiple Choice)
4.9/5 (43)
Filters
- Essay(0)
- Multiple Choice(0)
- Short Answer(0)
- True False(0)
- Matching(0)