Exam 13: Simple Linear Regression
Exam 1: Defining and Collecting Data189 Questions
Exam 3: Numerical Descriptive Measures184 Questions
Exam 4: Basic Probability156 Questions
Exam 5: Discrete Probability Distributions218 Questions
Exam 6: The Normal Distribution and Other Continuous Distributions189 Questions
Exam 7: Sampling Distributions127 Questions
Exam 8: Confidence Interval Estimation196 Questions
Exam 9: Fundamentals of Hypothesis Testing: One-Sample Tests170 Questions
Exam 10: Two-Sample Tests210 Questions
Exam 11: Analysis of Variance130 Questions
Exam 12: Chi-Square Tests and Nonparametric Tests175 Questions
Exam 13: Simple Linear Regression213 Questions
Exam 14: Introduction to Multiple Regression337 Questions
Exam 15: Multiple Regression Model Building96 Questions
Exam 16: Time-Series Forecasting165 Questions
Exam 17: A Roadmap for Analyzing Data303 Questions
Exam 18: Statistical Applications in Quality Management130 Questions
Exam 19: Decision Making126 Questions
Exam 20: Index Numbers44 Questions
Exam 21: Chi-Square Tests for the Variance or Standard Deviation11 Questions
Exam 22: Mcnemar Test for the Difference Between Two Proportions Related Samples15 Questions
Exam 25: The Analysis of Means Anom2 Questions
Exam 23: The Analysis of Proportions Anop3 Questions
Exam 24: The Randomized Block Design85 Questions
Exam 26: The Power of a Test41 Questions
Exam 27: Estimation and Sample Size Determination for Finite Populations13 Questions
Exam 28: Application of Confidence Interval Estimation in Auditing13 Questions
Exam 29: Sampling From Finite Populations20 Questions
Exam 30: The Normal Approximation to the Binomial Distribution27 Questions
Exam 31: Counting Rules14 Questions
Exam 32: Lets Get Started Big Things to Learn First33 Questions
Select questions type
TABLE 13-3
The director of cooperative education at a state college wants to examine the effect of cooperative education job experience on marketability in the work place.She takes a random sample of 4 students.For these 4,she finds out how many times each had a cooperative education job and how many job offers they received upon graduation.These data are presented in the table below. 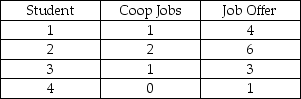 -Referring to Table 13-3,the coefficient of correlation is ________.
(Short Answer)
4.8/5  (38)
(38)
TABLE 13-7
An investment specialist claims that if one holds a portfolio that moves in the opposite direction to the market index like the S&P 500,then it is possible to reduce the variability of the portfolio's return.In other words,one can create a portfolio with positive returns but less exposure to risk.
A sample of 26 years of S&P 500 index and a portfolio consisting of stocks of private prisons,which are believed to be negatively related to the S&P 500 index,is collected.A regression analysis was performed by regressing the returns of the prison stocks portfolio (Y)on the returns of S&P 500 index (X)to prove that the prison stocks portfolio is negatively related to the S&P 500 index at a 5% level of significance.The results are given in the following EXCEL output. 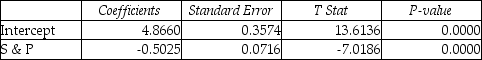 -Referring to Table 13-7,which of the following will be a correct conclusion?
(Multiple Choice)
4.9/5 (32)
TABLE 13-2
A candy bar manufacturer is interested in trying to estimate how sales are influenced by the price of their product.To do this,the company randomly chooses 6 small cities and offers the candy bar at different prices.Using candy bar sales as the dependent variable,the company will conduct a simple linear regression on the data below: 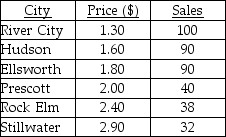 -Referring to Table 13-2,what is the coefficient of correlation for these data?
(Multiple Choice)
4.9/5 (25)
What do we mean when we say that a simple linear regression model is "statistically" useful?
(Multiple Choice)
4.8/5 (31)
TABLE 13-11
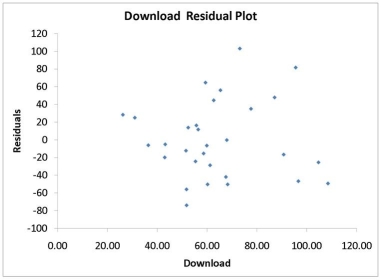
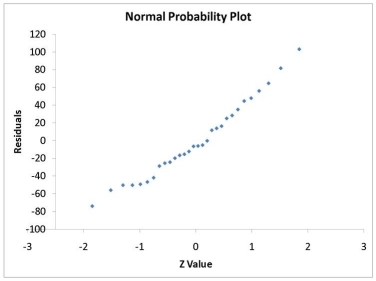
A computer software developer would like to use the number of downloads (in thousands)for the trial version of his new shareware to predict the amount of revenue (in thousands of dollars)he can make on the full version of the new shareware.Following is the output from a simple linear regression along with the residual plot and normal probability plot obtained from a data set of 30 different sharewares that he has developed: 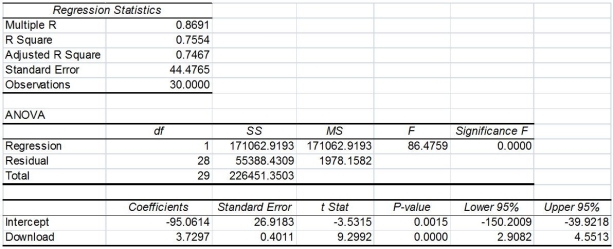
 -Referring to Table 13-11,what are the lower and upper limits of the 95% confidence interval estimate for population slope?
(Short Answer)
4.7/5 (33)
TABLE 13-3
The director of cooperative education at a state college wants to examine the effect of cooperative education job experience on marketability in the work place.She takes a random sample of 4 students.For these 4,she finds out how many times each had a cooperative education job and how many job offers they received upon graduation.These data are presented in the table below.
-Referring to Table 13-3,the least squares estimate of the slope is ________.
(Short Answer)
4.8/5 (32)
TABLE 13-7
An investment specialist claims that if one holds a portfolio that moves in the opposite direction to the market index like the S&P 500,then it is possible to reduce the variability of the portfolio's return.In other words,one can create a portfolio with positive returns but less exposure to risk.
A sample of 26 years of S&P 500 index and a portfolio consisting of stocks of private prisons,which are believed to be negatively related to the S&P 500 index,is collected.A regression analysis was performed by regressing the returns of the prison stocks portfolio (Y)on the returns of S&P 500 index (X)to prove that the prison stocks portfolio is negatively related to the S&P 500 index at a 5% level of significance.The results are given in the following EXCEL output.
-Referring to Table 13-7,to test whether the prison stocks portfolio is negatively related to the S&P 500 index,the p-value of the associated test statistic is ________.
(Short Answer)
4.7/5 (31)
TABLE 13-11
A computer software developer would like to use the number of downloads (in thousands)for the trial version of his new shareware to predict the amount of revenue (in thousands of dollars)he can make on the full version of the new shareware.Following is the output from a simple linear regression along with the residual plot and normal probability plot obtained from a data set of 30 different sharewares that he has developed:
-True or False: Referring to Table 13-11,the null hypothesis for testing whether there is a linear relationship between revenue and the number of downloads is,"There is no linear relationship between revenue and the number of downloads."
(True/False)
4.7/5 (26)
TABLE 13-5
The managing partner of an advertising agency believes that his company's sales are related to the industry sales.He uses Microsoft Excel to analyze the last 4 years of quarterly data with the following results: 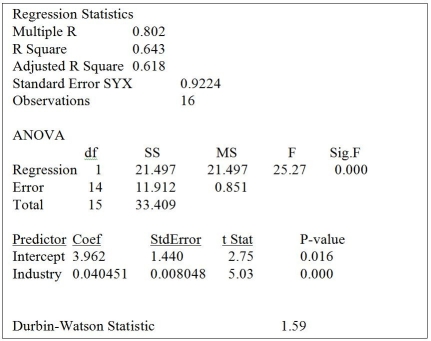 -Referring to Table 13-5,the prediction for a quarter in which X = 120 is Y = ________.
(Short Answer)
4.9/5 (30)
The sample correlation coefficient between X and Y is 0.375.It has been found out that the p-value is 0.256 when testing H0 : ρ = 0 against the two-sided alternative H1 : ρ ≠ 0.To test H0 : ρ = 0 against the one-sided alternative H1 : ρ > 0 at a significance level of 0.1,the p-value is
(Multiple Choice)
4.7/5 (38)
True or False: The Regression Sum of Squares (SSR)can never be greater than the Total Sum of Squares (SST).
(True/False)
5.0/5 (31)
TABLE 13-3
The director of cooperative education at a state college wants to examine the effect of cooperative education job experience on marketability in the work place.She takes a random sample of 4 students.For these 4,she finds out how many times each had a cooperative education job and how many job offers they received upon graduation.These data are presented in the table below.
-True or False: Referring to Table 13-3,suppose the director of cooperative education wants to construct both a 95% confidence interval estimate and a 95% prediction interval for X = 2.The confidence interval estimate would be the wider of the two intervals.
(True/False)
4.8/5 (39)
TABLE 13-3
The director of cooperative education at a state college wants to examine the effect of cooperative education job experience on marketability in the work place.She takes a random sample of 4 students.For these 4,she finds out how many times each had a cooperative education job and how many job offers they received upon graduation.These data are presented in the table below.
-Referring to Table 13-3,the regression sum of squares (SSR)is ________.
(Short Answer)
4.8/5 (40)
TABLE 13-8
It is believed that GPA (grade point average,based on a four point scale)should have a positive linear relationship with ACT scores.Given below is the Excel output for predicting GPA using ACT scores based on a data set of 8 randomly chosen students from a Big-Ten university. 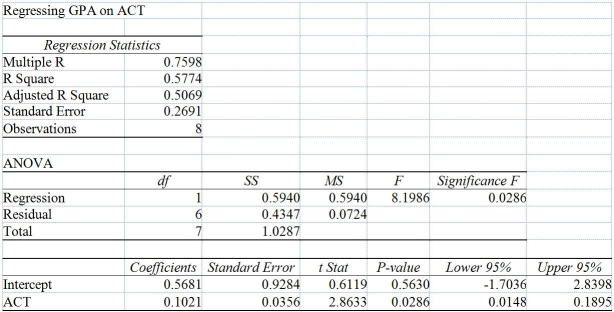 -Referring to Table 13-8,what is the predicted value of GPA when ACT = 20?
(Multiple Choice)
4.9/5 (42)
TABLE 13-13
In this era of tough economic conditions,voters increasingly ask the question: "Is the educational achievement level of students dependent on the amount of money the state in which they reside spends on education?" The partial computer output below is the result of using spending per student ($)as the independent variable and composite score which is the sum of the math,science and reading scores as the dependent variable on 35 states that participated in a study.The table includes only partial results. 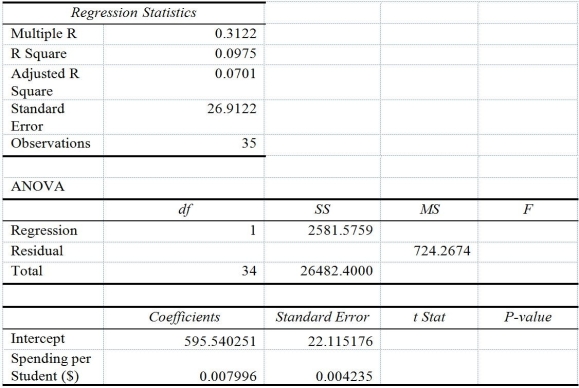 -Referring to Table 13-13,the error sum of squares (SSE)of the above regression is ________.
(Short Answer)
4.8/5 (42)
TABLE 13-3
The director of cooperative education at a state college wants to examine the effect of cooperative education job experience on marketability in the work place.She takes a random sample of 4 students.For these 4,she finds out how many times each had a cooperative education job and how many job offers they received upon graduation.These data are presented in the table below.
-Referring to Table 13-3,the director of cooperative education wanted to test the hypothesis that the population slope was equal to 3.0.The p-value of the test is between ________ and ________.
(Essay)
4.9/5 (29)
TABLE 13-2
A candy bar manufacturer is interested in trying to estimate how sales are influenced by the price of their product.To do this,the company randomly chooses 6 small cities and offers the candy bar at different prices.Using candy bar sales as the dependent variable,the company will conduct a simple linear regression on the data below:
-Referring to Table 13-2,what is the percentage of the total variation in candy bar sales explained by the regression model?
(Multiple Choice)
4.8/5 (37)
TABLE 13-2
A candy bar manufacturer is interested in trying to estimate how sales are influenced by the price of their product.To do this,the company randomly chooses 6 small cities and offers the candy bar at different prices.Using candy bar sales as the dependent variable,the company will conduct a simple linear regression on the data below:
-Referring to Table 13-2,if the price of the candy bar is set at $2,the predicted sales will be
(Multiple Choice)
4.8/5 (37)
TABLE 13-5
The managing partner of an advertising agency believes that his company's sales are related to the industry sales.He uses Microsoft Excel to analyze the last 4 years of quarterly data with the following results:
-Referring to Table 13-5,the standard error of the estimate is ________.
(Short Answer)
4.9/5 (31)
Filters
- Essay(0)
- Multiple Choice(0)
- Short Answer(0)
- True False(0)
- Matching(0)