Exam 9: Production and Cost in the Long Run
Exam 1: Managers,profits,and Markets54 Questions
Exam 2: Demand,supply,and Market Equilibrium76 Questions
Exam 3: Marginal Analysis for Optimal Decisions98 Questions
Exam 4: Basic Estimation Techniques24 Questions
Exam 5: Theory of Consumer Behavior105 Questions
Exam 6: Elasticity and Demand76 Questions
Exam 7: Demand Estimation and Forecasting65 Questions
Exam 8: Production and Cost in the Short Run107 Questions
Exam 9: Production and Cost in the Long Run89 Questions
Exam 10: Production and Cost Estimation53 Questions
Exam 11: Managerial Decisions in Competitive Markets98 Questions
Exam 12: Managerial Decisions for Firms With Market Power112 Questions
Exam 13: Strategic Decision Making in Oligopoly Markets62 Questions
Exam 14: Advanced Pricing Techniques57 Questions
Exam 15: Decisions Under Risk and Uncertainty60 Questions
Exam 16: Government Regulation of Business50 Questions
Select questions type
In the following graph,the price of labor is $15 per unit.Which of the following combinations of capital and labor lies on the expansion path?
(Multiple Choice)
5.0/5  (43)
(43)
Refer to the following graph.The price of labor is $3 per unit: What is the price per unit of capital? 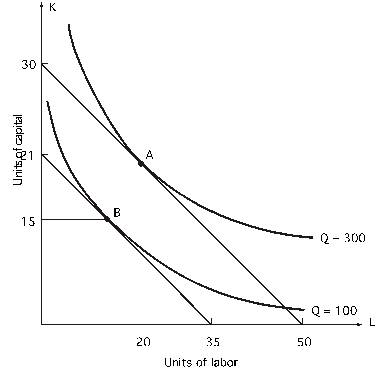
(Multiple Choice)
4.9/5 (41)
If there are no fixed costs in the long run,how can it be said that economies of scale arise from spreading fixed costs over more units of output?
(Multiple Choice)
4.8/5 (42)
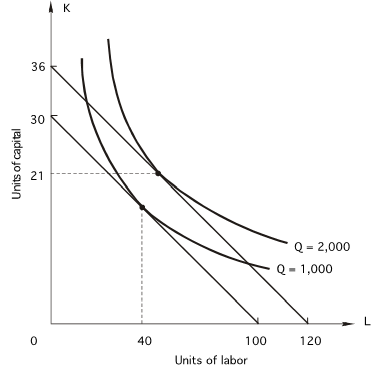
In the following graph,the price of capital is $100 per unit.Which of the following combinations of capital and labor lies on the expansion path? 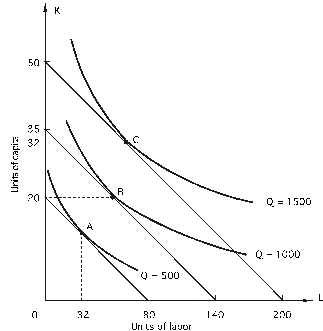
(Multiple Choice)
4.9/5 (42)
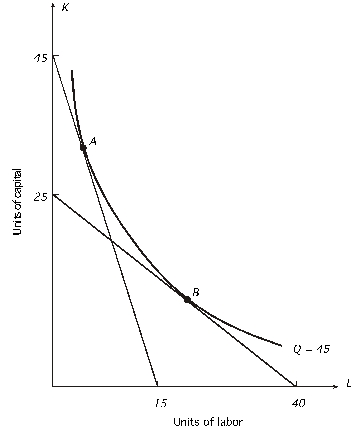 Given the above graph,if the firm continues to produce 45 units of output and moves from point A to point B,it must be true that
(Multiple Choice)
4.9/5 (31)
In the following graph,the price of capital is $100 per unit; the price of labor is $25 per unit.When output is 20 units,what is AVERAGE cost? 
(Multiple Choice)
4.9/5 (31)
Refer to the following figure.The price of capital is $50 per unit: 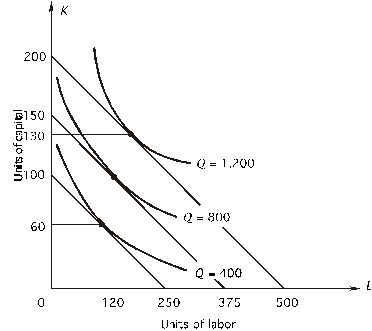 What is the marginal rate of technical substitution at each cost minimizing equilibrium point?
(Multiple Choice)
4.9/5 (44)
Filters
- Essay(0)
- Multiple Choice(0)
- Short Answer(0)
- True False(0)
- Matching(0)