Exam 9: Production and Cost in the Long Run
Exam 1: Managers,profits,and Markets54 Questions
Exam 2: Demand,supply,and Market Equilibrium76 Questions
Exam 3: Marginal Analysis for Optimal Decisions98 Questions
Exam 4: Basic Estimation Techniques24 Questions
Exam 5: Theory of Consumer Behavior105 Questions
Exam 6: Elasticity and Demand76 Questions
Exam 7: Demand Estimation and Forecasting65 Questions
Exam 8: Production and Cost in the Short Run107 Questions
Exam 9: Production and Cost in the Long Run89 Questions
Exam 10: Production and Cost Estimation53 Questions
Exam 11: Managerial Decisions in Competitive Markets98 Questions
Exam 12: Managerial Decisions for Firms With Market Power112 Questions
Exam 13: Strategic Decision Making in Oligopoly Markets62 Questions
Exam 14: Advanced Pricing Techniques57 Questions
Exam 15: Decisions Under Risk and Uncertainty60 Questions
Exam 16: Government Regulation of Business50 Questions
Select questions type
Refer to the following graph.The price of capital (r)is $20.  What combination of K and L should the firm choose to produce 14,000 units of output at the lowest cost?
Free
(Multiple Choice)
4.8/5  (38)
(38)
Correct Answer: Verified
D
A publishing house is using 400 printers and 200 printing presses to produce books.The printers' wage rate is $20 and the price of a printing press is $100.The last printer added 20 books to total output,while the last printing press added 50 books to total output.The publishing house
Free
(Multiple Choice)
4.7/5 (29)
Correct Answer:Verified
E
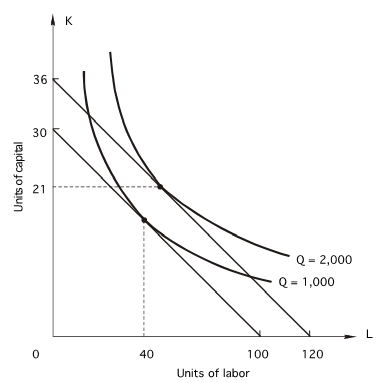
In the following graph,the price of labor is $15 per unit.The minimum cost of producing 1,000 units of output is:
Free
(Multiple Choice)
4.8/5 (27)
Correct Answer:Verified
E
In the graph below,the price of capital is $500 per unit.When output is 10,000 units,what is long-run average cost? 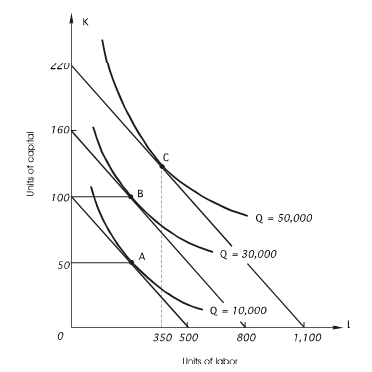
(Multiple Choice)
4.9/5 (43)
If the price of labor is $5 and the price of capital is $10,what is the marginal rate of technical substitution at the optimal input choice?
(Multiple Choice)
4.8/5 (41)
A cow will produce 8500 lbs.of milk if fed either 5000 lbs.of hay and 6200 lbs.of grain or 5600 lbs.of hay and 5400 lbs.of grain.Over this range,the marginal rate of technical substitution between hay and grain is
(Multiple Choice)
4.8/5 (39)
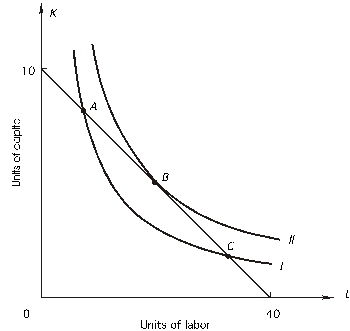
Refer to the following figure.The price of capital is $50 per unit: 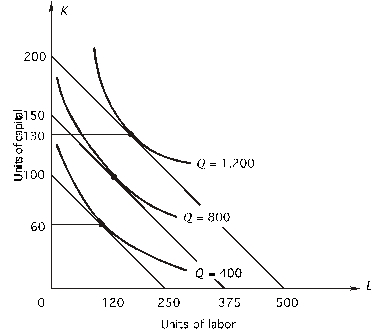 What is the price per unit of labor?
(Multiple Choice)
4.9/5 (39)
Refer to the following graph.The price of capital (r)is $20.  Why wouldn't the firm choose to produce 5,000 units of output with the combination at A?
(Multiple Choice)
4.7/5 (36)
In the graph below,the price of capital is $500 per unit.Given a total cost of $50,000,the maximum amount of output possible is 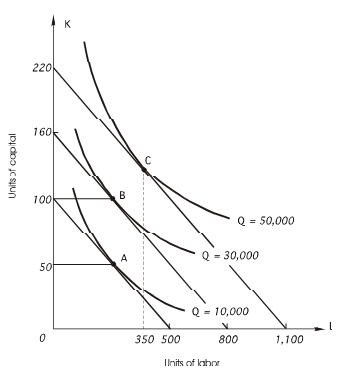
(Multiple Choice)
4.8/5 (36)
If the marginal rate of technical substitution of labor for capital is 6,the price of labor is $18,and the price of capital is $9,then the firm
(Multiple Choice)
4.9/5 (34)
Following is a firm's expansion path.The price of capital is $5 per unit; the price of labor is $2 per unit.
Units of Output 10 20 30 Units of Capital 6 8 13 Units of Labor 5 10 20
When output is 30 units,what is long-run total cost?
(Multiple Choice)
4.8/5 (34)
In the following graph,the price of capital is $100 per unit.What is the marginal rate of technical substitution at point C?
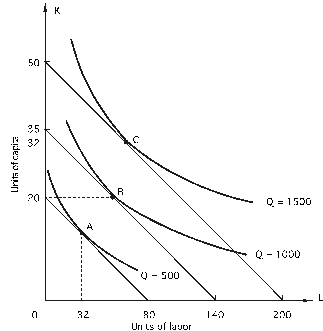
(Multiple Choice)
4.8/5 (43)
Suppose that when a firm increases output by 50%,long-run total cost increases by less than 50%.The firm will experience
(Multiple Choice)
4.8/5 (38)
Refer to the following graph.The price of labor is $3 per unit: 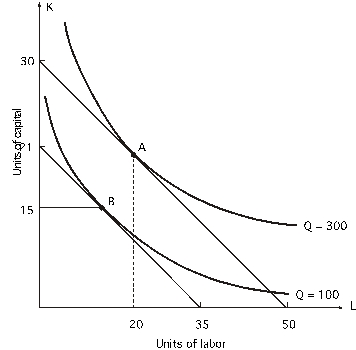 What is the marginal rate of technical substitution at point B?
(Multiple Choice)
4.8/5 (36)
 Given the above graph,as you move from input combination A to input combination C,
(Multiple Choice)
4.9/5 (36)
A firm is using 500 units of capital and 200 units of labor to produce 10,000 units of output. Capital costs $100 per unit and labor $20 per unit.The last unit of capital added 50 units of output,while the last unit of labor added 20 units of output.The firm
(Multiple Choice)
4.9/5 (41)
Refer to the following graph.The price of capital (r)is $20. 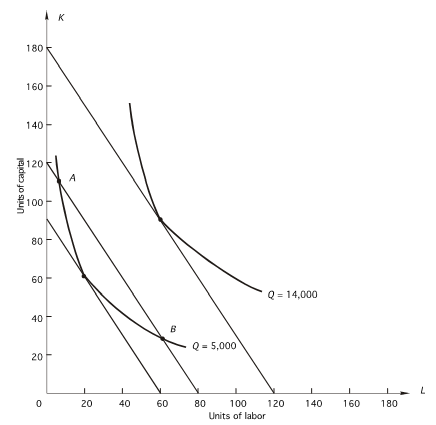 What is the lowest possible cost of producing 5,000 units of output?
(Multiple Choice)
4.8/5 (36)
producer is hiring 20 units of labor and 6 units of capital (bundle A).The price of labor is $10,the price of capital is $2,and at A,the marginal products of labor and capital are both equal to 20.The producer
(Multiple Choice)
4.8/5 (34)
Filters
- Essay(0)
- Multiple Choice(0)
- Short Answer(0)
- True False(0)
- Matching(0)