Exam 6: Elasticity and Demand
Exam 1: Managers,profits,and Markets54 Questions
Exam 2: Demand,supply,and Market Equilibrium76 Questions
Exam 3: Marginal Analysis for Optimal Decisions98 Questions
Exam 4: Basic Estimation Techniques24 Questions
Exam 5: Theory of Consumer Behavior105 Questions
Exam 6: Elasticity and Demand76 Questions
Exam 7: Demand Estimation and Forecasting65 Questions
Exam 8: Production and Cost in the Short Run107 Questions
Exam 9: Production and Cost in the Long Run89 Questions
Exam 10: Production and Cost Estimation53 Questions
Exam 11: Managerial Decisions in Competitive Markets98 Questions
Exam 12: Managerial Decisions for Firms With Market Power112 Questions
Exam 13: Strategic Decision Making in Oligopoly Markets62 Questions
Exam 14: Advanced Pricing Techniques57 Questions
Exam 15: Decisions Under Risk and Uncertainty60 Questions
Exam 16: Government Regulation of Business50 Questions
Select questions type
Use the figure to calculate the income elasticity of demand when income increases from $25,000 to $30,000: 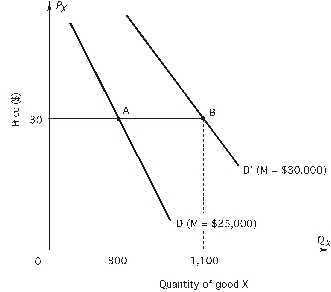
(Multiple Choice)
4.9/5  (34)
(34)
Refer to the following figure.When price is $15 and quantity demanded is 1,000,what is the point elasticity of demand? 
(Multiple Choice)
4.8/5 (42)
To answer the question,refer to the following table showing a demand schedule: \2 00 1000 150 1400 100 1800 If price falls from $150 to $100,
(Multiple Choice)
4.7/5 (18)
Refer to the following graph to answer the question: 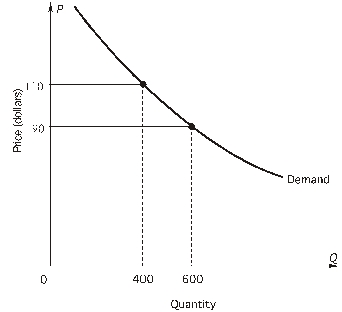 Suppose price rises from $90 to $110.Total revenue moves in the ________ (same,opposite)direction as the dominant effect.In this case,total revenue ____________ (increases,decreases,stays the same)because the quantity effect is _________ (larger than,smaller than,the same as)the price effect.
(Multiple Choice)
4.8/5 (42)
Refer to the following graph to answer the question:  The price elasticity of demand over the price interval $90 to $110 is
(Multiple Choice)
4.8/5 (36)
To answer the question,refer to the following table showing a demand schedule: \2 00 1000 150 1400 100 1800 If price rises from $100 to $150,
(Multiple Choice)
4.9/5 (32)
Refer to the following figure.When price is $5 and quantity demanded is 3,000,what is the point elasticity of demand? 
(Multiple Choice)
4.9/5 (46)
Refer to the following figure.When quantity demanded is 3,000,what is marginal revenue? 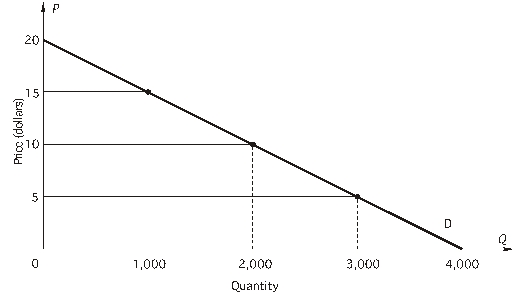
(Multiple Choice)
4.8/5 (41)
Total revenue increased for a firm operating in the elastic range of its demand curve.Which of the following statements is correct?
(Multiple Choice)
4.9/5 (28)
The demand for heart surgery is price inelastic.So it follows that
(Multiple Choice)
4.9/5 (37)
To answer the question,refer to the following table showing a demand schedule: \2 00 1000 150 1400 100 1800 If price falls from $200 to $150,
(Multiple Choice)
4.8/5 (37)
The fact that the cross-price elasticity of natural gas with respect to the price of fuel oil is 0.4 implies that
(Multiple Choice)
4.8/5 (42)
Refer to the following figure.When quantity demanded is 2,000,what is marginal revenue? 
(Multiple Choice)
5.0/5 (33)
Perfume industry statistics show that over the past five years,the number of bottles of perfume sold decreased by 30%,but the total dollar amount spent by consumers was unchanged.This means that
(Multiple Choice)
4.8/5 (35)
Interior Department recently announced that it will increase the entrance fees at Yellowstone National Park in order to increase park revenues.The Interior Department must believe that
(Multiple Choice)
4.7/5 (39)
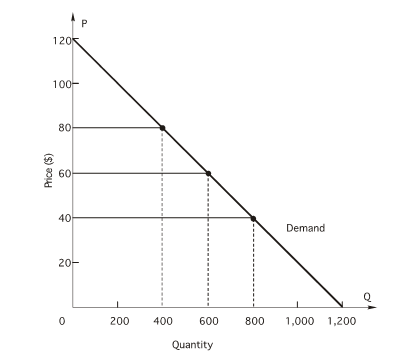 In the figure above,what is the point price elasticity of demand when price is $40?
(Multiple Choice)
4.7/5 (35)
According to the following figure,demand is unitary elastic at P = $________. 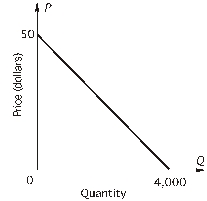
(Multiple Choice)
4.7/5 (39)
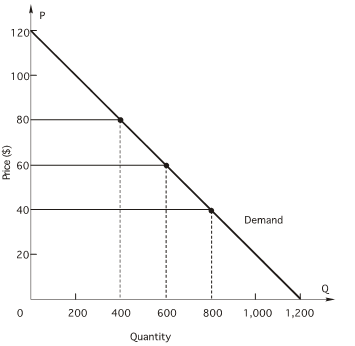 In the figure above,what is demand elasticity over the price range $40 to $60?
(Multiple Choice)
4.8/5 (41)
the figure below,which shows a linear demand curve and the associated total revenue curve,to answer the question. 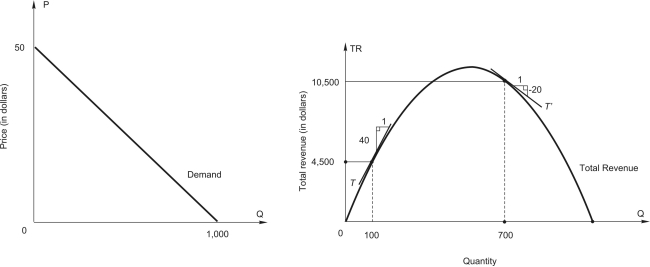 The price for which 100 units can be sold is $_____.
(Multiple Choice)
4.8/5 (37)
Filters
- Essay(0)
- Multiple Choice(0)
- Short Answer(0)
- True False(0)
- Matching(0)