Exam 17: Statistical Applications in Quality Management
Exam 1: Instruction and Data Collection47 Questions
Exam 2: Presenting Data in Tables and Charts277 Questions
Exam 3: Numerical Descriptive Measures139 Questions
Exam 4: Basic Probability137 Questions
Exam 5: Some Important Discrete Probability Distributions188 Questions
Exam 6: The Normal Distribution and Other Continuous Distributions164 Questions
Exam 7: Sampling and Sampling Distributions187 Questions
Exam 8: Confidence Interval Estimation173 Questions
Exam 9: Fundamentals of Hypothesis Testing: One-Sample Tests146 Questions
Exam 10: Two-Sample Tests190 Questions
Exam 11: Analysis of Variance127 Questions
Exam 12: Chi-Square Tests and Nonparametric Tests174 Questions
Exam 13: Simple Linear Regression198 Questions
Exam 14: Introduction to Multiple Regression215 Questions
Exam 15: Multiple Regression Model Building101 Questions
Exam 16: Time-Series Analysis and Index Numbers133 Questions
Exam 17: Statistical Applications in Quality Management132 Questions
Exam 18: Data Analysis Overview52 Questions
Select questions type
TABLE 17-4
A factory supervisor is concerned that the time it takes workers to complete an important production task (measured in seconds) is too erratic and adversely affects expected profits. The supervisor proceeds by randomly sampling 5 individuals per hour for a period of 10 hours. The sample mean and range for each hour are listed below.
 She also decides that lower and upper specification limit for the critical-to-quality variable should be 10 and 30 seconds, respectively.
-Referring to Table 17-4, what is the value of the CPU index?
She also decides that lower and upper specification limit for the critical-to-quality variable should be 10 and 30 seconds, respectively.
-Referring to Table 17-4, what is the value of the CPU index?
(Short Answer)
4.7/5  (32)
(32)
TABLE 17-10
Below is the number of defective items from a production line over twenty consecutive morning shifts.
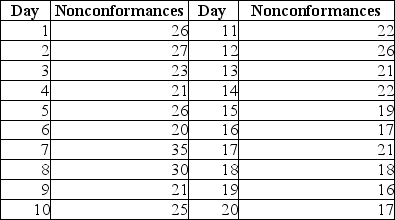 -Referring to Table 17-10, a c chart is to be constructed for the number of defective items. The center line of this c chart is located at ________.
(Short Answer)
4.9/5 (36)
TABLE 17-3
A quality control analyst for a light bulb manufacturer is concerned that the time it takes to produce a batch of light bulbs is too erratic. Accordingly, the analyst randomly surveys 10 production periods each day for 14 days and records the sample mean and range for each day.
 -Referring to Table 17-3, suppose the analyst constructs an R chart to see if the variability in production times is in-control. The R chart is characterized by which of the following?
(Multiple Choice)
4.8/5 (33)
TABLE 17-3
A quality control analyst for a light bulb manufacturer is concerned that the time it takes to produce a batch of light bulbs is too erratic. Accordingly, the analyst randomly surveys 10 production periods each day for 14 days and records the sample mean and range for each day.
-Referring to Table 17-3, suppose the sample mean and range data were based on 11 observations per day instead of 10. How would this change affect the lower and upper control limits of the R chart?
(Multiple Choice)
4.9/5 (34)
Which famous statistician developed the 14 Points of Quality?
(Multiple Choice)
4.9/5 (35)
TABLE 17-8
Recently, a university switched to a new type of computer-based registration. The registrar is concerned with the amount of time students are spending on the computer registering under the new system. She decides to randomly select 8 students on each of the 12 days of the registration and determine the time each spends on the computer registering. The range, mean, and standard deviation of the times required to register are in the table that follows.
 -Referring to Table 17-8, an
  chart is to be used for the time required to register. The lower control limit for this data set is ________, while the upper control limit is ________.
(Short Answer)
4.9/5 (38)
TABLE 17-8
Recently, a university switched to a new type of computer-based registration. The registrar is concerned with the amount of time students are spending on the computer registering under the new system. She decides to randomly select 8 students on each of the 12 days of the registration and determine the time each spends on the computer registering. The range, mean, and standard deviation of the times required to register are in the table that follows.
-Referring to Table 17-8, construct an  chart for the time required to register.
(Essay)
4.8/5 (34)
TABLE 17-8
Recently, a university switched to a new type of computer-based registration. The registrar is concerned with the amount of time students are spending on the computer registering under the new system. She decides to randomly select 8 students on each of the 12 days of the registration and determine the time each spends on the computer registering. The range, mean, and standard deviation of the times required to register are in the table that follows.
-Referring to Table 17-8, based on the  chart, it appears that the process is in control.
(True/False)
4.8/5 (34)
TABLE 17-8
Recently, a university switched to a new type of computer-based registration. The registrar is concerned with the amount of time students are spending on the computer registering under the new system. She decides to randomly select 8 students on each of the 12 days of the registration and determine the time each spends on the computer registering. The range, mean, and standard deviation of the times required to register are in the table that follows.
-Referring to Table 17-8, an R chart is to be constructed for the time required to register. The center line of this R chart is located at ________.
(Short Answer)
4.9/5 (46)
TABLE 17-10
Below is the number of defective items from a production line over twenty consecutive morning shifts.
-Referring to Table 17-10, the c chart suggests that the special cause of variation must be incorporated into the process to become part of the permanent ongoing process.
(True/False)
4.8/5 (40)
The CPL and CPU indexes are used to measure process' actual performance rather than its potential.
(True/False)
4.9/5 (44)
TABLE 17-4
A factory supervisor is concerned that the time it takes workers to complete an important production task (measured in seconds) is too erratic and adversely affects expected profits. The supervisor proceeds by randomly sampling 5 individuals per hour for a period of 10 hours. The sample mean and range for each hour are listed below.
She also decides that lower and upper specification limit for the critical-to-quality variable should be 10 and 30 seconds, respectively.
-Referring to Table 17-4, what is the value of the Cp index?
(Short Answer)
4.8/5 (30)
TABLE 17-9
The manufacturer of cat food constructed control charts and analyzed several quality characteristics. One characteristic of interest is the weight of the filled cans. The lower specification limit for weight is 2.95 pounds. The table below provides the range and mean of the weights of five cans tested every fifteen minutes during a day's production.
 -Referring to Table 17-9, construct an R chart for the time required to register.
(Essay)
4.7/5 (30)
TABLE 17-10
Below is the number of defective items from a production line over twenty consecutive morning shifts.
-Referring to Table 17-10, a c chart is to be constructed for the number of defective items. The lower control limit is ________.
(Short Answer)
4.9/5 (36)
The principal focus of the control chart is the attempt to separate special or assignable causes of variation from common causes of variation. What cause of variation can be reduced only by changing the system?
(Multiple Choice)
4.9/5 (39)
TABLE 17-8
Recently, a university switched to a new type of computer-based registration. The registrar is concerned with the amount of time students are spending on the computer registering under the new system. She decides to randomly select 8 students on each of the 12 days of the registration and determine the time each spends on the computer registering. The range, mean, and standard deviation of the times required to register are in the table that follows.
-Referring to Table 17-8, an R chart is to be constructed for the time required to register. The lower control limit for this data set is ________.
(Short Answer)
4.9/5 (27)
Filters
- Essay(0)
- Multiple Choice(0)
- Short Answer(0)
- True False(0)
- Matching(0)