Exam 17: Statistical Applications in Quality Management
Exam 1: Instruction and Data Collection47 Questions
Exam 2: Presenting Data in Tables and Charts277 Questions
Exam 3: Numerical Descriptive Measures139 Questions
Exam 4: Basic Probability137 Questions
Exam 5: Some Important Discrete Probability Distributions188 Questions
Exam 6: The Normal Distribution and Other Continuous Distributions164 Questions
Exam 7: Sampling and Sampling Distributions187 Questions
Exam 8: Confidence Interval Estimation173 Questions
Exam 9: Fundamentals of Hypothesis Testing: One-Sample Tests146 Questions
Exam 10: Two-Sample Tests190 Questions
Exam 11: Analysis of Variance127 Questions
Exam 12: Chi-Square Tests and Nonparametric Tests174 Questions
Exam 13: Simple Linear Regression198 Questions
Exam 14: Introduction to Multiple Regression215 Questions
Exam 15: Multiple Regression Model Building101 Questions
Exam 16: Time-Series Analysis and Index Numbers133 Questions
Exam 17: Statistical Applications in Quality Management132 Questions
Exam 18: Data Analysis Overview52 Questions
Select questions type
TABLE 17-10
Below is the number of defective items from a production line over twenty consecutive morning shifts.
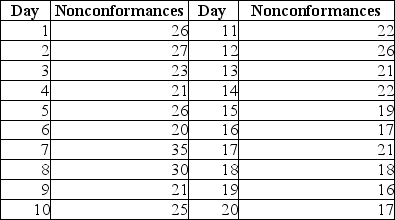 -Referring to Table 17-10, construct a c chart for the number of defective items.
(Essay)
4.9/5  (40)
(40)
TABLE 17-7
A supplier of silicone sheets for producers of computer chips wants to evaluate her manufacturing process. She takes samples of size 5 from each day's output and counts the number of blemishes on each silicone sheet. The results from 20 days of such evaluations are presented below.
 She also decides that the upper specification limit is 10 blemishes.
-Referring to Table 17-7, an R chart is to be constructed for the number of blemishes. One way to create the lower control limit involves multiplying the average of the sample ranges by D3. For this data set, the value of D3 is ________.
She also decides that the upper specification limit is 10 blemishes.
-Referring to Table 17-7, an R chart is to be constructed for the number of blemishes. One way to create the lower control limit involves multiplying the average of the sample ranges by D3. For this data set, the value of D3 is ________.
(Short Answer)
4.7/5 (34)
TABLE 17-5
A manufacturer of computer disks took samples of 240 disks on 15 consecutive days. The number of disks with bad sectors was determined for each of these samples. The results are in the table that follows.
 -Referring to Table 17-5, a p control chart is to be made for these data. The upper control limit is ________, and the lower control limit is ________.
(Short Answer)
4.8/5 (35)
One of the morals of the red bead experiment is that variation is part of any process.
(True/False)
4.8/5 (32)
TABLE 17-9
The manufacturer of cat food constructed control charts and analyzed several quality characteristics. One characteristic of interest is the weight of the filled cans. The lower specification limit for weight is 2.95 pounds. The table below provides the range and mean of the weights of five cans tested every fifteen minutes during a day's production.
 -Referring to Table 17-9, an R chart is to be constructed for the weight. The center line of this R chart is located at ________.
(Short Answer)
4.8/5 (29)
Common causes of variation are correctable without modifying the system.
(True/False)
4.8/5 (37)
TABLE 17-10
Below is the number of defective items from a production line over twenty consecutive morning shifts.
-Referring to Table 17-10, based on the c chart, no opportunity appears to be present to render an improvement in the process.
(True/False)
5.0/5 (35)
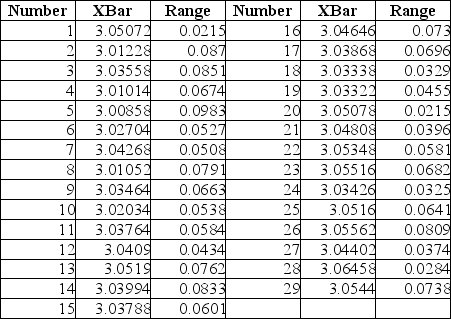
TABLE 17-9
The manufacturer of cat food constructed control charts and analyzed several quality characteristics. One characteristic of interest is the weight of the filled cans. The lower specification limit for weight is 2.95 pounds. The table below provides the range and mean of the weights of five cans tested every fifteen minutes during a day's production.
-Referring to Table 17-9, an  chart is to be used for the weight. The lower control limit for this data set is ________, while the upper control limit is ________.
(Short Answer)
4.8/5 (38)
TABLE 17-7
A supplier of silicone sheets for producers of computer chips wants to evaluate her manufacturing process. She takes samples of size 5 from each day's output and counts the number of blemishes on each silicone sheet. The results from 20 days of such evaluations are presented below.
She also decides that the upper specification limit is 10 blemishes.
-Referring to Table 17-7, construct an  chart for the number of blemishes.
(Essay)
4.9/5 (38)
TABLE 17-7
A supplier of silicone sheets for producers of computer chips wants to evaluate her manufacturing process. She takes samples of size 5 from each day's output and counts the number of blemishes on each silicone sheet. The results from 20 days of such evaluations are presented below.
She also decides that the upper specification limit is 10 blemishes.
-Referring to Table 17-7, an R chart is to be constructed for the number of blemishes. One way to create the upper control limit involves multiplying the average of the sample ranges by D4. For this data set, the value of D4 is ________.
(Short Answer)
4.9/5 (43)
Cp >1 indicates that if the process average can be centered, then more than 99.73% of the observations will fall inside the specification limits.
(True/False)
4.9/5 (33)
Filters
- Essay(0)
- Multiple Choice(0)
- Short Answer(0)
- True False(0)
- Matching(0)