Exam 16: B: Long-Run Macroeconomic Adjustments
Exam 1: B: Limits, Alternatives, and Choices265 Questions
Exam 1: A: - Limits, Alternatives, and Choices60 Questions
Exam 2: B: The Market System and the Circular Flow119 Questions
Exam 2: A: - The Market System and the Circular Flow42 Questions
Exam 3: B: Demand, Supply, and Market Equilibrium291 Questions
Exam 3: A: - Demand, Supply, and Market Equilibrium51 Questions
Exam 4: B: Market Failures: Public Goods and Externalities133 Questions
Exam 4: A: - Market Failures: Public Goods and Externalities36 Questions
Exam 5: B: Governments Role and Government Failure121 Questions
Exam 5: A: Governments Role and Government Failure1 Questions
Exam 6: B: an Introduction to Macroeconomics65 Questions
Exam 6: A: an Introduction to Macroeconomics31 Questions
Exam 7: B: Measuring the Economys Output191 Questions
Exam 7: A: Measuring the Economys Output30 Questions
Exam 8: B: Economic Growth122 Questions
Exam 8: A: Economic Growth35 Questions
Exam 9: B: Business Cycles, Unemployment, and Inflation193 Questions
Exam 9: A: Business Cycles, Unemployment, and Inflation40 Questions
Exam 10: B: Basic Macroeconomic Relationships200 Questions
Exam 10: A: Basic Macroeconomic Relationships26 Questions
Exam 11: B: The Aggregate Expenditures Model238 Questions
Exam 11: A: The Aggregate Expenditures Model47 Questions
Exam 12: B: Aggregate Demand and Aggregate Supply203 Questions
Exam 12: A: Aggregate Demand and Aggregate Supply35 Questions
Exam 13: B: Fiscal Policy, Deficits, Surpluses, and Debt234 Questions
Exam 13: A: Fiscal Policy, Deficits, Surpluses, and Debt53 Questions
Exam 14: B: Money, Banking, and Money Creation206 Questions
Exam 14: A: Money, Banking, and Money Creation56 Questions
Exam 15: B: Interest Rates and Monetary Policy239 Questions
Exam 15: A: Interest Rates and Monetary Policy47 Questions
Exam 17: C: Financial Economics323 Questions
Exam 16: A: Long-Run Macroeconomic Adjustments28 Questions
Exam 16: B: Long-Run Macroeconomic Adjustments122 Questions
Exam 17: A: International Trade40 Questions
Exam 17: B: International Trade188 Questions
Exam 18: A: The Balance of Payments and Exchange Rates30 Questions
Exam 18: B: The Balance of Payments and Exchange Rates133 Questions
Exam 22: The Economics of Developing Countries254 Questions
Select questions type
Demand-pull inflation in the short run increases the price level and:
(Multiple Choice)
4.8/5  (39)
(39)
Which factor contributed to the termination of stagflation in the 1980s?
(Multiple Choice)
4.8/5 (29)
An upward shift of the Phillips Curve is consistent with the occurrence of stagflation.
(True/False)
4.9/5 (33)
Most economists reject the idea of a long-run tradeoff between unemployment and inflation.
(True/False)
4.8/5 (44)
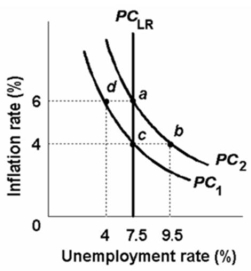 Refer to the above diagram.Assume that the natural rate of unemployment is 7.5 percent and that the economy is initially operating at point a where the expected and actual rates of inflation are each 6 percent.If the actual rate of inflation unexpectedly falls from 6 percent to 4 percent, then the unemployment rate will:
(Multiple Choice)
4.8/5 (29)
Refer to the diagram below.The initial aggregate demand curve is AD1 and the initial aggregate supply curve is AS1.Assuming no change in aggregate demand, the long-run response to a recession caused by cost-push inflation is best depicted as a: 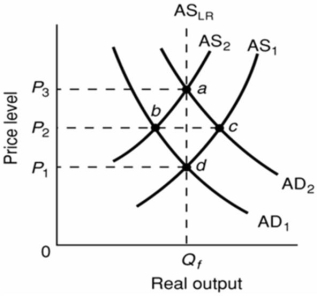
(Multiple Choice)
4.8/5 (38)
A criticism of the arguments for tax cuts made by supply-side economists is that the:
(Multiple Choice)
4.9/5 (29)
The Phillips Curve suggests an inverse relationship between increases in the price level and the level of employment.
(True/False)
4.7/5 (28)
 Refer to the above diagram.The initial aggregate demand curve is AD1 and the initial aggregate supply curve is AS1.Demand-pull inflation in the short run is best shown as:
(Multiple Choice)
4.8/5 (35)
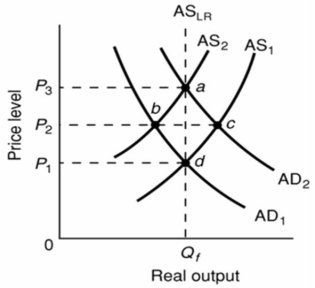
 Refer to the above diagram for a specific economy.Which of the following best describes a decision by policymakers which moves this economy from point b to point a?
(Multiple Choice)
4.8/5 (36)
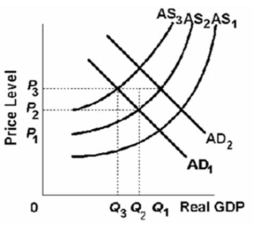 Refer to the above graph.Assume that the economy is at equilibrium at AD1 and AS1 and then is hit with both demand-pull and cost-push inflation.If this occurs, then, in the short run:
(Multiple Choice)
4.7/5 (31)
Demand-pull inflation and cost-push inflation are identical concepts because both entail rising nominal wages and rising prices.
(True/False)
4.7/5 (36)
Which of the following most significantly contributed to the 1970s' and the early 1980s' stagflation in Canada?
(Multiple Choice)
4.8/5 (33)
In terms of aggregate supply, the short run is a period in which:
(Multiple Choice)
4.8/5 (40)
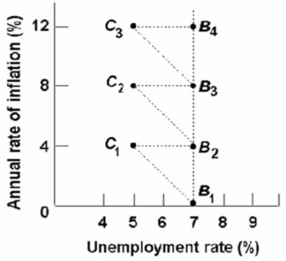 Refer to the above diagram and assume the economy is initially at point b1.According to the adaptive expectations theorists, the long-run relationship between the unemployment rate and the rate of inflation is represented by:
(Multiple Choice)
4.9/5 (39)
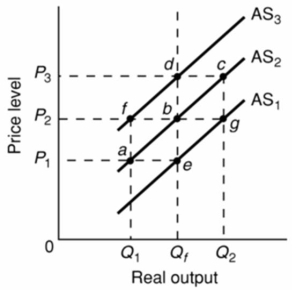 Refer to the above diagram.Assume that nominal wages initially are set on the basis of the price level P2 and that the economy initially is operating at its full-employment level of output Qf.In terms of this diagram, the long-run aggregate supply curve:
(Multiple Choice)
4.9/5 (44)
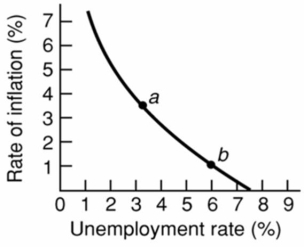
Refer to the graph below.The effects of stagflation, in the short run, are best represented by a shift from: 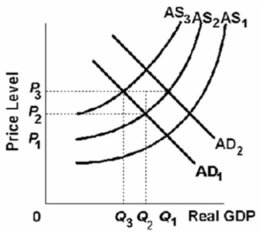
(Multiple Choice)
4.8/5 (35)
 Refer to the above graph.The economy is at point B2, and aggregate demand increases.In the short run, the economy will:
(Multiple Choice)
4.8/5 (47)
Filters
- Essay(0)
- Multiple Choice(0)
- Short Answer(0)
- True False(0)
- Matching(0)