Exam 2: Economic Theories, Data, and Graphs
Exam 1: Economic Issues and Concepts107 Questions
Exam 2: Economic Theories, Data, and Graphs114 Questions
Exam 3: Demand, Supply, and Price134 Questions
Exam 4: Elasticity124 Questions
Exam 5: Markets in Action114 Questions
Exam 6: Consumer Behaviour119 Questions
Exam 7: Producers in the Short Run120 Questions
Exam 8: Producers in the Long Run110 Questions
Exam 9: Competitive Markets125 Questions
Exam 10: Monopoly, Cartels, and Price Discrimination110 Questions
Exam 11: Imperfect Competition110 Questions
Exam 12: Economic Efficiency and Public Policy109 Questions
Exam 13: How Factor Markets Work123 Questions
Exam 14: Labour Markets92 Questions
Exam 15: Interest Rates and the Capital Market90 Questions
Exam 16: Market Failures and Government Intervention110 Questions
Exam 17: The Economics of Environmental Protection110 Questions
Exam 18: Taxation and Public Expenditure110 Questions
Exam 33: The Gains From International Trade112 Questions
Exam 34: Trade Policy114 Questions
Select questions type
Which of the following best describes the relationship between positive and normative statements in economics?
(Multiple Choice)
4.8/5  (47)
(47)
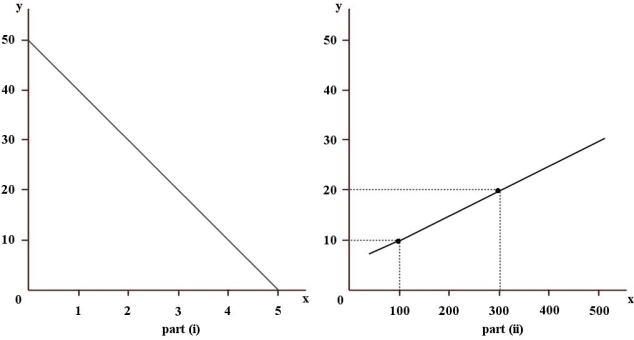 FIGURE 2- 1
-Refer to Figure 2- 1. What is the slope of the line in part (ii) of the figure?
FIGURE 2- 1
-Refer to Figure 2- 1. What is the slope of the line in part (ii) of the figure?
(Multiple Choice)
4.8/5 (31)
The statement that a two- percent increase in the money supply leads to a two- percent increase in the price level is an example of a(n)
(Multiple Choice)
4.8/5 (33)
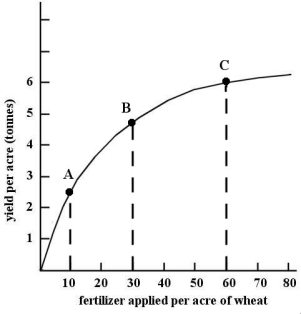 FIGURE 2- 4
-Refer to Figure 2- 4. The slope of the non- linear function changes as we move along the curve. The slope is
FIGURE 2- 4
-Refer to Figure 2- 4. The slope of the non- linear function changes as we move along the curve. The slope is
(Multiple Choice)
5.0/5 (37)
Which of the following pairs of words have similar meanings?
(Multiple Choice)
4.7/5 (39)
If we seek to explain the number of seats sold on a particular air route, say Toronto to Halifax, over a one- year period, we would consider many variables. Which of the following variables would be endogenous to our theory?
(Multiple Choice)
4.9/5 (43)
Suppose there is a theory that several things influence the price of fish in Halifax, one of which is the weather during the fishing season. When examining the determinants of the price of fish, the weather is
(Multiple Choice)
4.8/5 (37)
Consider the line which is the graph of the function Y = 60 - 4X. The slope of this line is
(Multiple Choice)
4.9/5 (34)
Suppose point A represents coordinates (X = 2, Y = 12) and point B represents coordinates (X = 6, Y
= 4). The slope of the straight line joining points A and B is
(Multiple Choice)
4.8/5 (37)
If the graph of a function is a horizontal line, the slope of this line is
(Multiple Choice)
4.8/5 (34)
What is the best way to display the unemployment rate in each of the world's developed economies in 2009?
(Multiple Choice)
4.9/5 (25)
Negatively related variables change such that as the value of one variable
(Multiple Choice)
4.8/5 (38)
When an increase in one variable is associated with an increase in a second variable, the two variables are
(Multiple Choice)
5.0/5 (26)
On a coordinate graph, what is the Y intercept of the function X = 60 + 3Y?
(Multiple Choice)
4.8/5 (36)
Filters
- Essay(0)
- Multiple Choice(0)
- Short Answer(0)
- True False(0)
- Matching(0)