Exam 2: Economic Theories, Data, and Graphs
Exam 1: Economic Issues and Concepts107 Questions
Exam 2: Economic Theories, Data, and Graphs114 Questions
Exam 3: Demand, Supply, and Price134 Questions
Exam 4: Elasticity124 Questions
Exam 5: Markets in Action114 Questions
Exam 6: Consumer Behaviour119 Questions
Exam 7: Producers in the Short Run120 Questions
Exam 8: Producers in the Long Run110 Questions
Exam 9: Competitive Markets125 Questions
Exam 10: Monopoly, Cartels, and Price Discrimination110 Questions
Exam 11: Imperfect Competition110 Questions
Exam 12: Economic Efficiency and Public Policy109 Questions
Exam 13: How Factor Markets Work123 Questions
Exam 14: Labour Markets92 Questions
Exam 15: Interest Rates and the Capital Market90 Questions
Exam 16: Market Failures and Government Intervention110 Questions
Exam 17: The Economics of Environmental Protection110 Questions
Exam 18: Taxation and Public Expenditure110 Questions
Exam 33: The Gains From International Trade112 Questions
Exam 34: Trade Policy114 Questions
Select questions type
The table below shows hypothetical per- minute cell phone charges for "pay- and- talk" service over several years. 2005 0.55 2006 0.50 2007 0.40 2008 0.35 2009 0.25 TABLE 2- 2
-Refer to Table 2- 2. Assume that 2005 is used as the base year, with the index number = 100. The value of the index number in 2007 is
(Multiple Choice)
4.9/5  (43)
(43)
The table below shows hypothetical tuition costs at a Canadian university. Year Tuition 2005 \ 5000 2006 \ 5050 2007 \ 5100 2008 \ 5150 2009 \ 5200 TABLE 2- 1
-Refer to Table 2- 1. Assume that 2005 is used as the base year, with the index number = 100. The value of the index number in 2009 is
(Multiple Choice)
4.8/5 (26)
Suppose an individual wheat farmer's income is influenced by the region's average daily temperature. When examining the determinants of individual farmer income, the average daily temperature is a(n) variable.
(Multiple Choice)
4.9/5 (34)
The table below shows hypothetical per- minute cell phone charges for "pay- and- talk" service over several years. 2005 0.55 2006 0.50 2007 0.40 2008 0.35 2009 0.25 TABLE 2- 2
-Refer to Table 2- 2. Assume that 2005 is used as the base year, with the index number = 100. The value of the index number in 2008 is calculated as follows:
(Multiple Choice)
4.7/5 (41)
An assertion about the desirability of reducing unemployment by lowering payroll taxes is most likely
(Multiple Choice)
4.8/5 (33)
An index number expresses the value of a variable in any given period
(Multiple Choice)
4.8/5 (42)
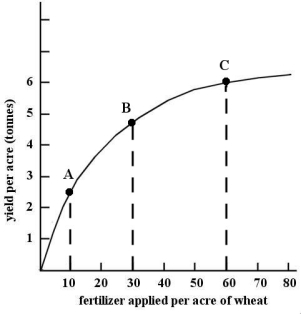 FIGURE 2- 4
-Refer to Figure 2- 4. This non- linear function shows that over the range shown,
FIGURE 2- 4
-Refer to Figure 2- 4. This non- linear function shows that over the range shown,
(Multiple Choice)
4.8/5 (32)
Using the scientific method to approach an economic issue involves
(Multiple Choice)
4.9/5 (46)
The table below shows hypothetical per- minute cell phone charges for "pay- and- talk" service over several years. 2005 0.55 2006 0.50 2007 0.40 2008 0.35 2009 0.25 TABLE 2- 2
-Refer to Table 2- 2. Assume that 2005 is used as the base year, with the index number = 100. The value of the index number in 2009 is
(Multiple Choice)
4.9/5 (45)
Suppose point A represents co- ordinates (X=10, Y=12) and point B represents co- ordinates (X=5, Y=7). The slope of the straight line joining points A and B is
(Multiple Choice)
4.8/5 (33)
Filters
- Essay(0)
- Multiple Choice(0)
- Short Answer(0)
- True False(0)
- Matching(0)