Exam 2: Economic Theories, Data, and Graphs
Exam 1: Economic Issues and Concepts107 Questions
Exam 2: Economic Theories, Data, and Graphs114 Questions
Exam 3: Demand, Supply, and Price134 Questions
Exam 4: Elasticity124 Questions
Exam 5: Markets in Action114 Questions
Exam 6: Consumer Behaviour119 Questions
Exam 7: Producers in the Short Run120 Questions
Exam 8: Producers in the Long Run110 Questions
Exam 9: Competitive Markets125 Questions
Exam 10: Monopoly, Cartels, and Price Discrimination110 Questions
Exam 11: Imperfect Competition110 Questions
Exam 12: Economic Efficiency and Public Policy109 Questions
Exam 13: How Factor Markets Work123 Questions
Exam 14: Labour Markets92 Questions
Exam 15: Interest Rates and the Capital Market90 Questions
Exam 16: Market Failures and Government Intervention110 Questions
Exam 17: The Economics of Environmental Protection110 Questions
Exam 18: Taxation and Public Expenditure110 Questions
Exam 33: The Gains From International Trade112 Questions
Exam 34: Trade Policy114 Questions
Select questions type
Suppose that a particular theory predicts that on sunny days consumption of ice cream will rise and that on cloudy days consumption of ice cream will fall. If an economist tests this theory and finds that over a six- month period the theory predicts accurately, the economist would likely say
(Multiple Choice)
4.8/5  (35)
(35)
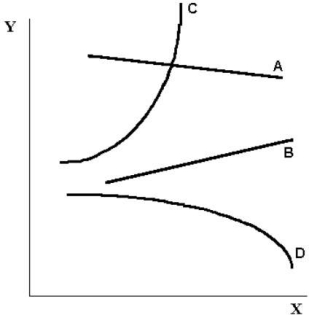 FIGURE 2- 2
-Refer to Figure 2- 2. The slope of curve C is
FIGURE 2- 2
-Refer to Figure 2- 2. The slope of curve C is
(Multiple Choice)
5.0/5 (45)
Suppose we observe that consumption of electricity decreases when the price of electricity rises. We can say that the two variables are related
(Multiple Choice)
4.8/5 (28)
Suppose we have data for 1000 students for a period of one year. The data show that those students who spend more hours studying have a higher grade point average (GPA). We can say that
(Multiple Choice)
4.7/5 (30)
When an economist assumes that the owners of firms are motivated only by the desire to maximize profits, the economist most likely believes that
(Multiple Choice)
4.7/5 (41)
An economist has data showing household income and energy consumption for 10 000 Canadian households. The best way to illustrate these data is
(Multiple Choice)
4.8/5 (28)
At the minimum or the maximum of the graph of a non- linear function (with x on the horizontal axis and y on the vertical axis) the marginal response of y to a small change in x is
(Multiple Choice)
4.9/5 (38)
When using statistics in economics, the possibility of error
(Multiple Choice)
4.7/5 (32)
Suppose an economist tells you that, on average, people in Canada have too much personal debt. This is an example of a(n) statement.
(Multiple Choice)
4.9/5 (39)
For a given year, an index number of average prices (such as the Consumer Price Index) is the ratio of the
(Multiple Choice)
4.8/5 (43)
The table below shows hypothetical tuition costs at a Canadian university. Year Tuition 2005 \ 5000 2006 \ 5050 2007 \ 5100 2008 \ 5150 2009 \ 5200 TABLE 2- 1
-Refer to Table 2- 1. Assume that 2005 is used as the base year, with the index number = 100. The value of the index number in 2007 is calculated as follows:
(Multiple Choice)
4.8/5 (43)
Filters
- Essay(0)
- Multiple Choice(0)
- Short Answer(0)
- True False(0)
- Matching(0)