Exam 15: Time-Series Forecasting and Index Numbers
Exam 1: Introduction to Statistics and Business Analytics180 Questions
Exam 2: Visualizing Data With Charts and Graphs113 Questions
Exam 3: Descriptive Statistics88 Questions
Exam 4: Probability104 Questions
Exam 5: Discrete Distributions98 Questions
Exam 6: Continuous Distributions105 Questions
Exam 7: Sampling and Sampling Distributions97 Questions
Exam 8: Statistical Inference: Estimation for Single Populations94 Questions
Exam 9: Statistical Inference: Hypothesis Testing for Single Populations123 Questions
Exam 10: Statistical Inferences About Two Populations97 Questions
Exam 11: Analysis of Variance and Design of Experiments133 Questions
Exam 12: Simple Regression Analysis and Correlation111 Questions
Exam 13: Multiple Regression Analysis90 Questions
Exam 14: Building Multiple Regression Models100 Questions
Exam 15: Time-Series Forecasting and Index Numbers103 Questions
Exam 16: Analysis of Categorical Data85 Questions
Exam 17: Nonparametric Statistics110 Questions
Exam 18: Statistical Quality Control99 Questions
Exam 19: Decision Analysis109 Questions
Select questions type
Two popular general categories of smoothing techniques are averaging models and exponential models.
(True/False)
4.7/5  (42)
(42)
For large datasets, the mean error (ME)and mean absolute deviation (MAD)always have the same numerical value.
(True/False)
4.8/5 (28)
The table below shows the prices in $ and quantities (thousands)for five specialized electronic components for 2000 and 2016.  The Paasche price index for 2016 using 2000 as base year is ______.
(Multiple Choice)
4.7/5 (32)
Weighted aggregate price indexes are also known as _______.
(Multiple Choice)
4.9/5 (27)
Analysis of data for an autoregressive forecasting model produced the following tables. 
 The results indicate that __________.
(Multiple Choice)
4.9/5 (38)
In an autoregressive forecasting model, the independent variable(s)is (are)______.
(Multiple Choice)
4.9/5 (31)
A time series with forecast values is presented in the following table: Month Actual. Forecast Jan a Mar 12a 1.1a May 1.15a 1.2a Jul 1.25a 12.21a 1.3a 1.25a
If the mean absolute deviation (MAD)is 257, then a = ______.
(Multiple Choice)
4.9/5 (38)
The actual value of a variable for July was 195.The researcher is using exponential smoothing with α = 0.30 and determines that the forecast value for August is 205.5.Then the forecast value for July was ______.
(Multiple Choice)
4.9/5 (37)
Suppose that for a time-series model with one predictor, you compute a Durbin-Watson statistic D = 1.409.Assume that n = 30 and α = 0.01.Then your decision is to ______.
(Multiple Choice)
4.8/5 (37)
A seasonal index for quarterly data is found as the ratio of ____________ to ___________ and is then multiplied by 100.
(Multiple Choice)
4.9/5 (31)
The table below shows the prices in $ and quantities (thousands)for five specialized electronic components for 2000 and 2016.  If the Paasche price index for 2016 using 2000 as base year is 137.75, then P = ______.
(Multiple Choice)
4.9/5 (35)
Naïve forecasting models have no useful applications because they do not take into account data trend, cyclical effects or seasonality.
(True/False)
4.9/5 (41)
When forecasting with exponential smoothing, data from previous periods is _________.
(Multiple Choice)
4.8/5 (30)
A time series analysis was performed to determine the number of new online customers that joined the 'Jelly of the Month Club'.The actual number of new customers, the forecast values and the error terms are presented in the following table.The mean squared error (MSE)for this forecast is ___________. Monthh Actual Forecast Error July 4 Aug 6 5 -1 Sept 3 6 3 Oct 9 8 -1 Nov 8 9 1
(Multiple Choice)
4.7/5 (42)
Autocorrelation in a regression forecasting model can be detected by the F test.
(True/False)
4.8/5 (34)
Typically, the denominator used to calculate an index number is a measurement for the ____________ period.
(Multiple Choice)
4.9/5 (35)
The following graph of time-series data suggests a _______________ trend. 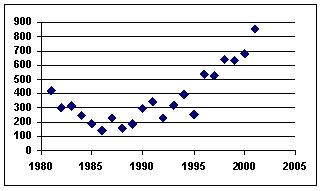

(Multiple Choice)
4.9/5 (42)
The city golf course is interested in starting a junior golf program.The golf pro has collected data on the number of youths under 13 that have played golf during the last 4 months.Using a three-month moving average, the forecast value for October made at the end of September in the following time series would be ____________. Joly 28 Ang 27 Sept 17 Oct 19
(Multiple Choice)
4.8/5 (29)
An exponential smoothing technique in which the smoothing constant alpha is equal to one is equivalent to a regression forecasting model.
(True/False)
4.9/5 (31)
The city golf course is interested in starting a junior golf program.The golf pro has collected data on the number of youths under 13 that have played golf during the last 4 months.Using a three-month moving average, the forecast value for November in the following time series would be ____________. Joly 28 Ang 27 Sept 17 Oct 19
(Multiple Choice)
4.8/5 (33)
Filters
- Essay(0)
- Multiple Choice(0)
- Short Answer(0)
- True False(0)
- Matching(0)