Exam 13: Multiple Regression Analysis
Exam 1: Introduction to Statistics and Business Analytics180 Questions
Exam 2: Visualizing Data With Charts and Graphs113 Questions
Exam 3: Descriptive Statistics88 Questions
Exam 4: Probability104 Questions
Exam 5: Discrete Distributions98 Questions
Exam 6: Continuous Distributions105 Questions
Exam 7: Sampling and Sampling Distributions97 Questions
Exam 8: Statistical Inference: Estimation for Single Populations94 Questions
Exam 9: Statistical Inference: Hypothesis Testing for Single Populations123 Questions
Exam 10: Statistical Inferences About Two Populations97 Questions
Exam 11: Analysis of Variance and Design of Experiments133 Questions
Exam 12: Simple Regression Analysis and Correlation111 Questions
Exam 13: Multiple Regression Analysis90 Questions
Exam 14: Building Multiple Regression Models100 Questions
Exam 15: Time-Series Forecasting and Index Numbers103 Questions
Exam 16: Analysis of Categorical Data85 Questions
Exam 17: Nonparametric Statistics110 Questions
Exam 18: Statistical Quality Control99 Questions
Exam 19: Decision Analysis109 Questions
Select questions type
The following ANOVA table is from a multiple regression analysis. Source F p Repression 3 1500 Error 26 Total 2300 The number of independent variables in the analysis is __________.
(Multiple Choice)
4.8/5  (35)
(35)
The mean square error (MSerr)is calculated by dividing the sum of squares error (SSerr)by the number of observations in the data set (N).
(True/False)
4.9/5 (35)
A market analyst is developing a regression model to predict monthly household expenditures on groceries as a function of family size, household income, and household neighborhood (urban, suburban, and rural).The response variable in this model is _____.
(Multiple Choice)
4.8/5 (38)
The following ANOVA table is from a multiple regression analysis. Source F p Repression 3 1500 Error 26 Total 2300 The sample size for the analysis is __________.
(Multiple Choice)
4.9/5 (36)
Multiple t-tests are used to determine whether the independent variables in the regression model are significant.
(True/False)
4.9/5 (37)
In the model y = 0 + 1x1 + 2x2 + 3x3 + ,y is the independent variable.
(True/False)
4.7/5 (42)
A multiple regression analysis produced the following tables. Predictor Coefficients Stardard Error Statistic p -value Irtercept -139.609 2548.989 -0.05477 0.957154 24.24619 22.25267 1.089586 32.10171 17.44559 1.840105 0.08869 Source SS MS F p -value Repression 2 302689 151344.5 1.705942 0.219838 Residual 13 1153309 88716.07 Total 15 1455998 These results indicate that ____________.
(Multiple Choice)
4.9/5 (42)
The F test is used to determine whether the overall regression model is significant.
(True/False)
4.8/5 (38)
A cost accountant is developing a regression model to predict the total cost of producing a batch of printed circuit boards as a linear function of batch size (the number of boards produced in one lot or batch), production plant (Kingsland, and Yorktown), and production shift (day, and evening).In this model, "batch size" is ______.
(Multiple Choice)
4.8/5 (32)
The following ANOVA table is from a multiple regression analysis. Source F p Repression 4068.5 Error 135.1 Total 11018.4 The adjusted R2 value is closest to__________.
(Multiple Choice)
4.8/5 (43)
The following ANOVA table is from a multiple regression analysis with n = 35 and four independent variables. Source F p Repression 700 Error Total 1000 The number of degrees of freedom for error is __________.
(Multiple Choice)
4.9/5 (35)
In the multiple regression model y = 0 + 1x1 + 2x2 + 3x3 + , the coefficients of the x variables are called partial regression coefficients.
(True/False)
4.8/5 (41)
A multiple regression analysis produced the following tables. Predictor Coefficients Stardard Eror Statistic p -value Irtercept 616.6849 154.5534 3.990108 0.000947 -3.33833 -1.43058 1.780075 5.30407 5.83-05 Source SS MS F p -value Repression 2 121783 60891.48 14.76117 0.000286 Residual 15 61876.68 4125.112 Total 17 183659.6 The regression equation for this analysis is ____________.
(Multiple Choice)
4.7/5 (34)
A slope in a multiple regression model is known as a partial slope because it ignores the effects of other explanatory variables.
(True/False)
4.9/5 (29)
A multiple regression analysis produced the following tables. Predictor Coefficients Stardard Error t Statistic p -value Irtercept 624.5369 78.49712 7.956176 6.88E-06 8.569122 1.652255 5.186319 4.736515 0.699194 6.774248 Source SS MS F p -value Repression 2 1660914 58.31956 1.4-06 Residual 11 156637.5 14239.77 Total 13 1817552 The adjusted R2 is ____________.
(Multiple Choice)
4.9/5 (34)
A multiple regression analysis produced the following tables. Predictor Coefficierts Stardard Error -value Irntercept 752.0833 11.87375 5.32047 1.908183 Source SS MS F p -value Regression 2 203693.3 101846.7 6.745406 0.010884 Residual 12 181184.1 15098.67 Total 14 384877.4 Using = 0.10 to test the null hypothesis H0: 2 = 0, the critical t value is ____.
(Multiple Choice)
4.9/5 (32)
The following ANOVA table is from a multiple regression analysis with n = 35 and four independent variables. Source F p Repression 700 Error Total 1000 The MSR value is __________.
(Multiple Choice)
4.9/5 (40)
The following ANOVA table is from a multiple regression analysis. Source F p Repression 3 1500 Error 26 Total 2300 The adjusted R2 value is __________.
(Multiple Choice)
4.7/5 (41)
A multiple regression analysis produced the following tables. 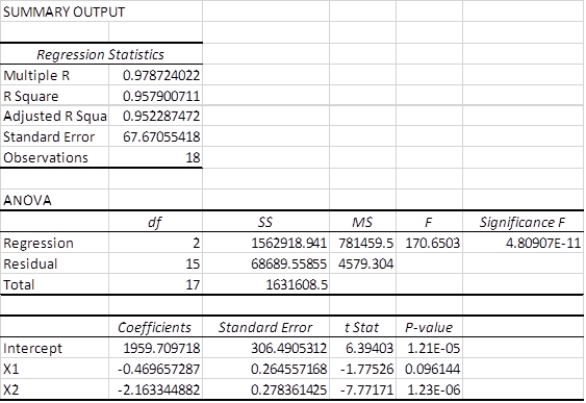 The regression equation for this analysis is ____________.
(Multiple Choice)
4.9/5 (42)
The standard error of the estimate of a multiple regression model is computed by taking the square root of the SSE divided by the degrees of freedom of error for the model.
(True/False)
4.8/5 (43)
Filters
- Essay(0)
- Multiple Choice(0)
- Short Answer(0)
- True False(0)
- Matching(0)