Exam 13: Multiple Regression Analysis
Exam 1: Introduction to Statistics and Business Analytics180 Questions
Exam 2: Visualizing Data With Charts and Graphs113 Questions
Exam 3: Descriptive Statistics88 Questions
Exam 4: Probability104 Questions
Exam 5: Discrete Distributions98 Questions
Exam 6: Continuous Distributions105 Questions
Exam 7: Sampling and Sampling Distributions97 Questions
Exam 8: Statistical Inference: Estimation for Single Populations94 Questions
Exam 9: Statistical Inference: Hypothesis Testing for Single Populations123 Questions
Exam 10: Statistical Inferences About Two Populations97 Questions
Exam 11: Analysis of Variance and Design of Experiments133 Questions
Exam 12: Simple Regression Analysis and Correlation111 Questions
Exam 13: Multiple Regression Analysis90 Questions
Exam 14: Building Multiple Regression Models100 Questions
Exam 15: Time-Series Forecasting and Index Numbers103 Questions
Exam 16: Analysis of Categorical Data85 Questions
Exam 17: Nonparametric Statistics110 Questions
Exam 18: Statistical Quality Control99 Questions
Exam 19: Decision Analysis109 Questions
Select questions type
The following ANOVA table is from a multiple regression analysis. Source F p Repression 3 1500 Error 26 Total 2300 The MSE value is closest to__________.
(Multiple Choice)
4.9/5  (34)
(34)
The following ANOVA table is from a multiple regression analysis. Source F p Repression 3 1500 Error 26 Total 2300 The observed F value is __________.
(Multiple Choice)
4.9/5 (31)
A market analyst is developing a regression model to predict monthly household expenditures on groceries as a function of family size, household income, and household neighborhood (urban, suburban, and rural).The "neighborhood" variable in this model is ______.
(Multiple Choice)
4.7/5 (33)
A multiple regression analysis produced the following output from Excel. 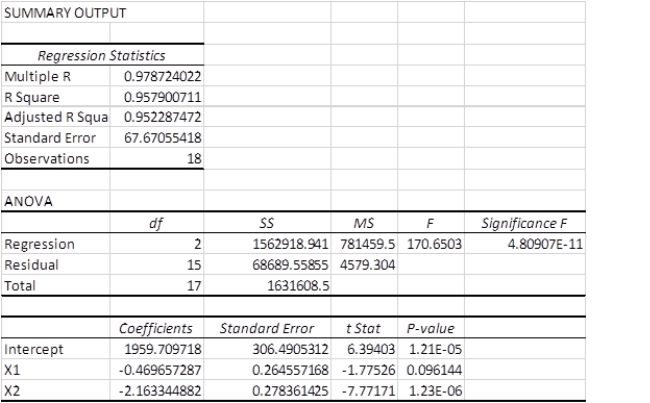 The correlation coefficient is ____________.
(Multiple Choice)
4.9/5 (33)
A multiple regression analysis produced the following tables. Predictor Coefficients Stardard Eror Statistic p -value Irtercept 616.6849 154.5534 3.990108 0.000947 -3.33833 -1.43058 1.780075 5.30407 5.83-05 Source SS MS F p -value Repression 2 121783 60891.48 14.76117 0.000286 Residual 15 61876.68 4125.112 Total 17 183659.6 These results indicate that ____________.
(Multiple Choice)
4.8/5 (27)
Regression analysis with two dependent variables and two or more independent variables is called multiple regression.
(True/False)
4.8/5 (27)
The following ANOVA table is from a multiple regression analysis. Source F p Repression 3 1500 Error 26 Total 2300 The R2 value is __________.
(Multiple Choice)
4.8/5 (41)
In a multiple regression model, the partial regression coefficient of an independent variable represents the increase in the y variable when that independent variable is increased by one unit if the values of all other independent variables are held constant.
(True/False)
4.7/5 (34)
A multiple regression analysis produced the following tables. Predictor Coefficients Stardard Error t Statistic p -value Irtercept 512.2359 78.49712 7.956176 6.88-06 7.1525 1.652255 5.186319 0.699194 6.774248 Source SS MS F p -value Repression 2 1660914 58.31956 1.4-06 Residual 11 156637.5 14239.77 Total 13 1817552 If x1= 25 and x2 = 85, then the predicted value of y is ____________.
(Multiple Choice)
4.8/5 (34)
Filters
- Essay(0)
- Multiple Choice(0)
- Short Answer(0)
- True False(0)
- Matching(0)