Exam 13: Multiple Regression Analysis
Exam 1: Introduction to Statistics and Business Analytics180 Questions
Exam 2: Visualizing Data With Charts and Graphs113 Questions
Exam 3: Descriptive Statistics88 Questions
Exam 4: Probability104 Questions
Exam 5: Discrete Distributions98 Questions
Exam 6: Continuous Distributions105 Questions
Exam 7: Sampling and Sampling Distributions97 Questions
Exam 8: Statistical Inference: Estimation for Single Populations94 Questions
Exam 9: Statistical Inference: Hypothesis Testing for Single Populations123 Questions
Exam 10: Statistical Inferences About Two Populations97 Questions
Exam 11: Analysis of Variance and Design of Experiments133 Questions
Exam 12: Simple Regression Analysis and Correlation111 Questions
Exam 13: Multiple Regression Analysis90 Questions
Exam 14: Building Multiple Regression Models100 Questions
Exam 15: Time-Series Forecasting and Index Numbers103 Questions
Exam 16: Analysis of Categorical Data85 Questions
Exam 17: Nonparametric Statistics110 Questions
Exam 18: Statistical Quality Control99 Questions
Exam 19: Decision Analysis109 Questions
Select questions type
A multiple regression analysis produced the following tables. Predictor Coefficients Stardard Error Statistic p -value Irtercept -139.609 2548.989 -0.05477 0.957154 24.24619 22.25267 1.089586 32.10171 17.44559 1.840105 0.08869 Source SS MS F p -value Repression 2 302689 151344.5 1.705942 0.219838 Residual 13 1153309 88716.07 Total 15 1455998 The regression equation for this analysis is ____________.
(Multiple Choice)
4.9/5  (32)
(32)
Minitab and Excel output for a multiple regression model show the F test for the overall model, but do not provide the t tests for the regression coefficients.
(True/False)
4.8/5 (32)
In a multiple regression analysis with N observations and k independent variables, the degrees of freedom for the residual error is given by (N - k - 1).
(True/False)
4.9/5 (36)
A market analyst is developing a regression model to predict monthly household expenditures on groceries as a function of family size, household income, and household neighborhood (urban, suburban, and rural).The "income" variable in this model is ____.
(Multiple Choice)
4.8/5 (37)
The value of adjusted R2 always goes up when a nontrivial explanatory variable is added to a regression model.
(True/False)
4.8/5 (37)
A multiple regression analysis produced the following tables. Predictor Coefficients Stardard Error t Statistic p -value Irtercept 624.5369 78.49712 7.956176 6.88E-06 8.569122 1.652255 5.186319 4.736515 0.699194 6.774248 Source SS MS F p -value Repression 2 1660914 58.31956 1.4-06 Residual 11 156637.5 14239.77 Total 13 1817552 The coefficient of multiple determination is ____________.
(Multiple Choice)
4.9/5 (42)
The value of R2 always goes up when a nontrivial explanatory variable is added to a regression model.
(True/False)
4.8/5 (30)
A multiple regression analysis produced the following output from Excel. 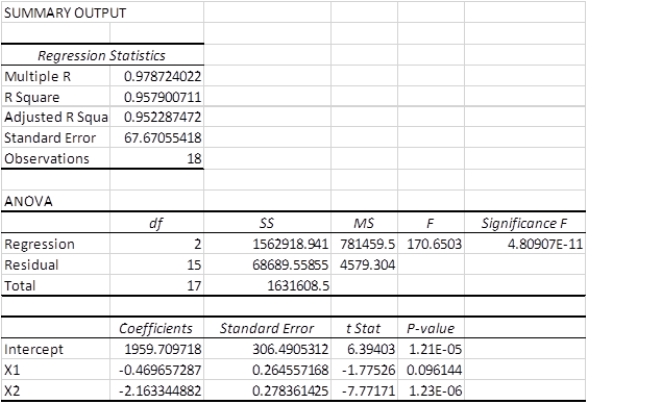 The overall proportion of variation of y accounted by x1 and x2 is _______
(Multiple Choice)
4.7/5 (26)
A multiple regression analysis produced the following output from Minitab. Regression Analysis: Y versus x1 and x2
Predictor Coef SE Coef T P
Constant -0.0626 0.2034 -0.31 0.762
X1 1.1003 0.5441 2.02 0.058
X2 -0.8960 0.5548 -1.61 0.124
S = 0.179449 R-Sq = 89.0% R-Sq(adj)= 87.8%
Analysis of Variance
Source DF SS MS F P
Regression 2 4.7013 2.3506 73.00 0.000
Residual Error 18 0.5796 0.0322
Total 20 5.2809
These results indicate that ____________.
(Multiple Choice)
4.7/5 (36)
A multiple regression analysis produced the following tables.  These results indicate that ____________.
(Multiple Choice)
4.8/5 (34)
The following ANOVA table is from a multiple regression analysis with n = 35 and four independent variables. Source F p Repression 700 Error Total 1000 The observed F value is __________.
(Multiple Choice)
4.9/5 (34)
A multiple regression analysis produced the following tables.  Using = 0.05 to test the null hypothesis H0: 1 = 0, the correct decision is ____.
(Multiple Choice)
4.9/5 (28)
A real estate appraiser is developing a regression model to predict the market value of single-family residential houses as a function of heated area, number of bedrooms, number of bathrooms, age of the house, and central heating (yes, no).The "central heating" variable in this model is _______.
(Multiple Choice)
4.9/5 (34)
The following ANOVA table is from a multiple regression analysis with n = 35 and four independent variables. Source F p Repression 700 Error Total 1000 The MSE value is __________.
(Multiple Choice)
4.8/5 (39)
A multiple regression analysis produced the following tables. Predictor Coefficients Stardard Eror Statistic p -value Irtercept 616.6849 154.5534 3.990108 0.000947 -3.33833 -1.43058 1.780075 5.30407 5.83-05 Source SS MS F p -value Repression 2 121783 60891.48 14.76117 0.000286 Residual 15 61876.68 4125.112 Total 17 183659.6 Using = 0.01 to test the null hypothesis H0: 1 = 2 = 0, the critical F value is ____.
(Multiple Choice)
4.8/5 (47)
The following ANOVA table is from a multiple regression analysis with n = 35 and four independent variables. Source F p Repression 700 Error Total 1000 The adjusted R2 value is __________.
(Multiple Choice)
4.9/5 (38)
In a multiple regression analysis with N observations and k independent variables, the degrees of freedom for the residual error is given by (N - k).
(True/False)
4.8/5 (32)
The following ANOVA table is from a multiple regression analysis. Source F p Repression 3 1728 Error 25 Total 2571 The R2 value is __________.
(Multiple Choice)
4.8/5 (27)
A human resources analyst is developing a regression model to predict electricity plant manager compensation as a function of production capacity of the plant, number of employees at the plant, and plant technology (coal, oil, and nuclear).The response variable in this model is ______.
(Multiple Choice)
4.8/5 (38)
A multiple regression analysis produced the following tables.  The sample size for this analysis is ____________.
(Multiple Choice)
4.8/5 (36)
Filters
- Essay(0)
- Multiple Choice(0)
- Short Answer(0)
- True False(0)
- Matching(0)