Exam 12: Production and Cost Analysis II
Exam 1: Economics and Economic Reasoning121 Questions
Exam 2: The Production Possibility Model, Trade, and Globalization111 Questions
Exam 3: Economic Institutions144 Questions
Exam 4: Supply and Demand151 Questions
Exam 5: Using Supply and Demand136 Questions
Exam 6: Describing Supply and Demand: Elasticities176 Questions
Exam 7: Taxation and Government Intervention169 Questions
Exam 8: Market Failure Versus Government Failure160 Questions
Exam 9: Comparative Advantage, Exchange Rates, and Globalization107 Questions
Exam 10: International Trade Policy82 Questions
Exam 11: Production and Cost Analysis I160 Questions
Exam 12: Production and Cost Analysis II129 Questions
Exam 13: Perfect Competition137 Questions
Exam 14: Monopoly and Monopolistic Competition231 Questions
Exam 15: Oligopoly and Antitrust Policy111 Questions
Exam 16: Real-World Competition and Technology86 Questions
Exam 17: Work and the Labor Market130 Questions
Exam 18: Who Gets What the Distribution of Income100 Questions
Exam 19: The Logic of Individual Choice: the Foundation of Supply and Demand134 Questions
Exam 20: Game Theory, Strategic Decision Making, and Behavioral Economics76 Questions
Exam 21: Thinking Like a Modern Economist67 Questions
Exam 22: Behavioral Economics and Modern Economic Policy87 Questions
Exam 23: Microeconomic Policy, Economic Reasoning, and Beyond111 Questions
Select questions type
A firm finds that producing 30,000 vases costs $180,000 and producing 40,000 vases costs $200,000. This pattern might be explained by:
(Multiple Choice)
4.9/5  (40)
(40)
Refer to the graph shown. The marginal rate of substitution at point B is: 
(Multiple Choice)
4.8/5 (35)
Refer to the graph shown. The output range in region a is associated with: 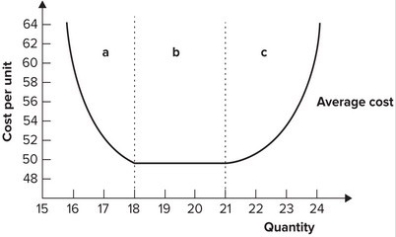
(Multiple Choice)
4.7/5 (35)
The production techniques available to real-world firms are constantly changing because of learning by doing and technological change.
(True/False)
4.9/5 (43)
Refer to the graph shown. A firm planning to produce 1,500 units of output would choose the scale of operation represented by: 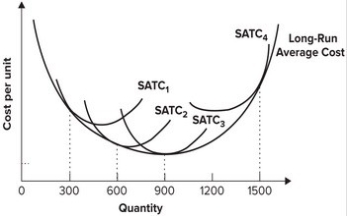
(Multiple Choice)
4.9/5 (37)
Refer to the graph shown. A firm that shifts from SATC1 to SATC2 is most likely to do so because planned output increases: 
(Multiple Choice)
4.7/5 (34)
Refer to the graph shown. If the firm's total cost is $375, labor must cost: 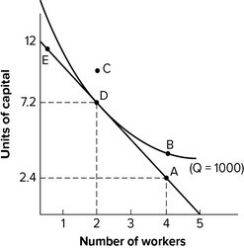
(Multiple Choice)
5.0/5 (36)
The relationship between long-run and short-run average total costs is known as the:
(Multiple Choice)
4.7/5 (45)
Which of the following provides the best explanation for constant returns to scale?
(Multiple Choice)
4.8/5 (35)
If the average total cost of supplying a good exceeds the price at which the good can be sold, then entrepreneurs have:
(Multiple Choice)
4.8/5 (41)
Economies of scale account for what part of a long-run average total cost curve?
(Multiple Choice)
4.9/5 (33)
Which of the following is most likely an example of constant returns to scale?
(Multiple Choice)
4.8/5 (40)
Refer to the graph shown. If the firm wishes to double output from 500 to 1,000: 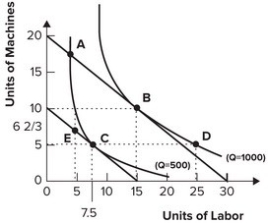
(Multiple Choice)
4.8/5 (40)
Some children in Siliguri, India, work as low-wage professional rock breakers. The rocks they break with a hammer are used in buildings and roads. In terms of the idea of efficiency, having children break rocks with hammers:
(Multiple Choice)
4.9/5 (32)
Since capital is relatively scarce in India, the economically efficient method of producing food would probably:
(Multiple Choice)
4.9/5 (37)
An entrepreneur would be least likely to develop a product if expected average total cost is:
(Multiple Choice)
5.0/5 (46)
Refer to the graph shown. The most economically efficient way to produce 1,000 units of output is to use: 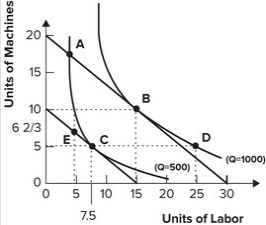
(Multiple Choice)
4.8/5 (38)
Filters
- Essay(0)
- Multiple Choice(0)
- Short Answer(0)
- True False(0)
- Matching(0)