Exam 12: Production and Cost Analysis II
Exam 1: Economics and Economic Reasoning121 Questions
Exam 2: The Production Possibility Model, Trade, and Globalization111 Questions
Exam 3: Economic Institutions144 Questions
Exam 4: Supply and Demand151 Questions
Exam 5: Using Supply and Demand136 Questions
Exam 6: Describing Supply and Demand: Elasticities176 Questions
Exam 7: Taxation and Government Intervention169 Questions
Exam 8: Market Failure Versus Government Failure160 Questions
Exam 9: Comparative Advantage, Exchange Rates, and Globalization107 Questions
Exam 10: International Trade Policy82 Questions
Exam 11: Production and Cost Analysis I160 Questions
Exam 12: Production and Cost Analysis II129 Questions
Exam 13: Perfect Competition137 Questions
Exam 14: Monopoly and Monopolistic Competition231 Questions
Exam 15: Oligopoly and Antitrust Policy111 Questions
Exam 16: Real-World Competition and Technology86 Questions
Exam 17: Work and the Labor Market130 Questions
Exam 18: Who Gets What the Distribution of Income100 Questions
Exam 19: The Logic of Individual Choice: the Foundation of Supply and Demand134 Questions
Exam 20: Game Theory, Strategic Decision Making, and Behavioral Economics76 Questions
Exam 21: Thinking Like a Modern Economist67 Questions
Exam 22: Behavioral Economics and Modern Economic Policy87 Questions
Exam 23: Microeconomic Policy, Economic Reasoning, and Beyond111 Questions
Select questions type
The reason for the merger of two businesses that sell unrelated goods but can share business practices and sales forces might best be explained by:
(Multiple Choice)
4.8/5  (41)
(41)
Refer to the graph shown. The cost of 5 units of labor and 6 2/3 units of machines is the same as the cost of: 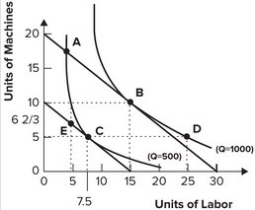
(Multiple Choice)
4.8/5 (43)
An isocost line is a line that represents combinations of:
(Multiple Choice)
5.0/5 (34)
When the number of mega-producers of hobs that operated at a lower average cost than smaller producers rose, the number of hogs slaughtered rose to record levels. What economic concept does this describe?
(Multiple Choice)
4.8/5 (44)
ABC Co. produces only gadgets, and XYZ Co. produces both gadgets and widgets. If ABC Co. produces gadgets at the same average total cost as XYZ Co., economies of:
(Multiple Choice)
4.9/5 (40)
Refer to the graph shown. If the firm wants to produce 900 units of output, it should use the plant size represented by: 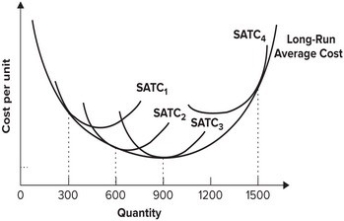
(Multiple Choice)
4.9/5 (36)
Suppose the average total cost of producing semiconductors in a factory of a particular size declines over time as more semiconductors are produced. This drop in average total cost might best be explained by:
(Multiple Choice)
4.9/5 (32)
At the planned output level, short-run average total cost equals long-run average total cost, but at all other points, short-run average total cost is higher than long-run average total cost.
(True/False)
4.8/5 (36)
A firm can use 5 workers and 10 machines, 7 workers and 9 machines, or 8 workers and 9 machines to produce four cars. If each worker costs $200 and each machine is rented for $50, the economically efficient input combination is:
(Multiple Choice)
4.7/5 (45)
An entrepreneur most likely would develop a product if expected average total cost is:
(Multiple Choice)
4.9/5 (35)
Refer to the graph shown. If a firm wants to produce 300 units of output, it should use the plant size represented by: 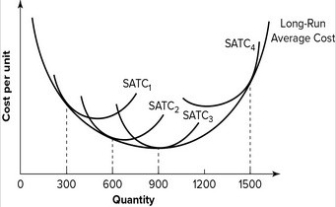
(Multiple Choice)
4.7/5 (26)
Refer to the graph shown. The cheapest way to produce 1,000 units of output is with: 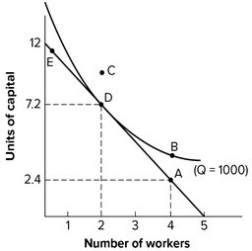
(Multiple Choice)
4.8/5 (33)
Refer to the graph shown. The output range in region c is associated with: 
(Multiple Choice)
4.9/5 (34)
Refer to the graph shown. The graph exhibits economies of scale: 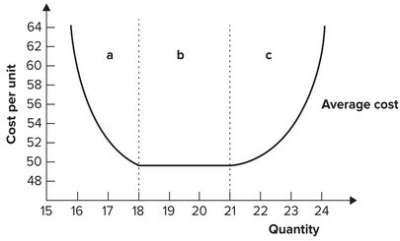
(Multiple Choice)
4.8/5 (34)
A firm's average cost increases as it increases its output by expanding its plant and hiring additional workers (its only inputs to production). The firm's owner blames the increase in per-unit costs on the law of diminishing marginal productivity. The owner's reasoning is:
(Multiple Choice)
5.0/5 (41)
When per-unit costs increase as output increases, there are economies of scale in production.
(True/False)
4.9/5 (42)
Economies of scale do not exist in the presence of indivisible setup costs.
(True/False)
4.9/5 (41)
Economies of scope exist when the production of one good is less costly because other related goods already are being produced.
(True/False)
4.9/5 (41)
Refer to the graph shown. The shift from SATC1 to SATC2 reflects: 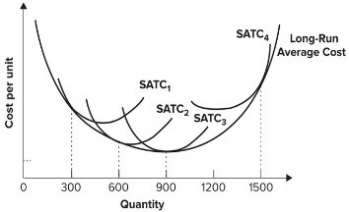
(Multiple Choice)
4.9/5 (36)
Filters
- Essay(0)
- Multiple Choice(0)
- Short Answer(0)
- True False(0)
- Matching(0)