Exam 9: The Single-Sample T Test
Exam 1: An Introduction to Statistics and Research Design156 Questions
Exam 2: Frequency Distributions89 Questions
Exam 3: Visual Displays of Data108 Questions
Exam 4: Central Tendency and Variability108 Questions
Exam 5: Sampling and Probability145 Questions
Exam 6: The Normal Curve, Standardization and Z Scores142 Questions
Exam 7: Hypothesis Testing With Z Tests141 Questions
Exam 8: Confidence Intervals, Effect Size, and Statistical Power147 Questions
Exam 9: The Single-Sample T Test124 Questions
Exam 10: The Paired-Samples T Test101 Questions
Exam 11: The Independent-Samples T Test99 Questions
Exam 12: One-Way Between-Groups Anova108 Questions
Exam 13: One-Way Within-Groups Anova102 Questions
Exam 14: Two-Way Between-Groups Anova115 Questions
Exam 15: Correlation139 Questions
Exam 16: Regression113 Questions
Exam 17: Chi-Square Tess120 Questions
Exam 18: Choosing and Reporting Statistics105 Questions
Select questions type
When there is uncertainty about the parameters of a population of interest, a t distribution is used instead of a z distribution.Is the t distribution wider or thinner than the z distribution and why?
(Multiple Choice)
4.8/5  (35)
(35)
What is the correct formula for calculating the standard deviation of a sample when one is NOT trying to estimate the population standard deviation?
(Multiple Choice)
4.8/5 (40)
A sample of 20 with a standard deviation of 92.41 results in a standard error calculated as 20.66.
(True/False)
4.7/5 (40)
The t test is used when the mean and standard deviation of the population are known.
(True/False)
4.8/5 (39)
Griffin is looking through a statistics text for a z table, but he can find only a t table in the index.What tip would best help him find the information he needs?
(Multiple Choice)
4.7/5 (37)
The single-sample t test compares the mean of a sample to a population for which the mean and standard deviation is known.
(True/False)
4.7/5 (32)
An effect size of 0.53 was calculated on data after performing a hypothesis test with a single-sample t statistic in which the null hypothesis was rejected.What can be concluded about the results based on this information?
(Multiple Choice)
4.7/5 (39)
As degrees of freedom decrease, the critical cutoff for the t test decreases.
(True/False)
4.8/5 (36)
As degrees of freedom increase, the critical cutoff for the t test increases.
(True/False)
4.9/5 (38)
The first step in creating a dot plot is to determine the range of scores in the data set.
(True/False)
4.8/5 (34)
Use the following to answer questions
This figure represents the distribution of the percent of state residents living in a metropolitan area for all 50 U.S.states and Washington D.C. 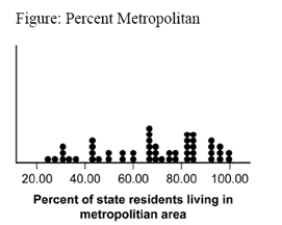 -(Figure: Percent Metropolitan) The figure indicates that:
(Multiple Choice)
4.9/5 (32)
What is one benefit of increasing the sample size when using t distributions?
(Multiple Choice)
4.9/5 (33)
When computing the confidence interval for a t test, the cutoffs for the 95 percent interval are always the same.
(True/False)
4.9/5 (38)
The _____ indicates the distance of a sample mean from a population mean in terms of the standard error.
(Multiple Choice)
4.8/5 (34)
Based on the statistical results provided, which would lead us to fail to reject the null hypothesis?
(Multiple Choice)
4.9/5 (42)
The correct formula for effect size using Cohen's d for a single-sample t test is:
(Multiple Choice)
4.7/5 (34)
Filters
- Essay(0)
- Multiple Choice(0)
- Short Answer(0)
- True False(0)
- Matching(0)