Exam 9: The Single-Sample T Test
Exam 1: An Introduction to Statistics and Research Design156 Questions
Exam 2: Frequency Distributions89 Questions
Exam 3: Visual Displays of Data108 Questions
Exam 4: Central Tendency and Variability108 Questions
Exam 5: Sampling and Probability145 Questions
Exam 6: The Normal Curve, Standardization and Z Scores142 Questions
Exam 7: Hypothesis Testing With Z Tests141 Questions
Exam 8: Confidence Intervals, Effect Size, and Statistical Power147 Questions
Exam 9: The Single-Sample T Test124 Questions
Exam 10: The Paired-Samples T Test101 Questions
Exam 11: The Independent-Samples T Test99 Questions
Exam 12: One-Way Between-Groups Anova108 Questions
Exam 13: One-Way Within-Groups Anova102 Questions
Exam 14: Two-Way Between-Groups Anova115 Questions
Exam 15: Correlation139 Questions
Exam 16: Regression113 Questions
Exam 17: Chi-Square Tess120 Questions
Exam 18: Choosing and Reporting Statistics105 Questions
Select questions type
Imagine the average time to complete a 4-year bachelor degree is actually 4.7 years based on national data.You collect data on the 68 psychology students who started school during the same semester as you, finding an average time to complete at 4.3 years with a standard deviation of 0.6 years.What would be the effect size associated with a single-sample t test?
(Multiple Choice)
4.9/5  (38)
(38)
Many companies that manufacture lightbulbs advertise their 60-watt bulbs as having an average life of 1000 hours.A cynical consumer bought 30 bulbs and burned them until they failed.He found that they burned for an average of M = 1233, with a standard deviation of s = 232.06.What statistical test would this consumer use to determine whether the average burn time of lightbulbs differs significantly from that advertised?
(Multiple Choice)
4.9/5 (44)
The first step in conducting the single-sample t test includes:
(Multiple Choice)
4.9/5 (44)
A researcher is comparing two groups.The population mean from which the samples come is known, but not the population standard deviation.Which test should be used?
(Multiple Choice)
4.7/5 (44)
The formula for the degrees of freedom for the single-sample t test is:
(Multiple Choice)
4.8/5 (39)
Which report of statistical results is in appropriate APA format?
(Multiple Choice)
4.9/5 (33)
Two types of graphs that make it easy to see the distribution of two variables side-by-side are the:
(Multiple Choice)
4.9/5 (37)
A dot plot allows us to _____, while a stem-and-leaf plot does not.
(Multiple Choice)
4.9/5 (43)
Use the following to answer questions
This figure represents the distribution of the percent of state residents living in a metropolitan area for all 50 U.S.states and Washington D.C. 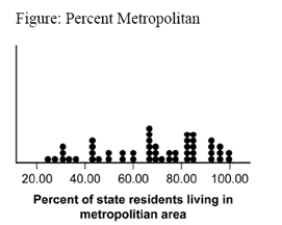 -(Figure: Percent Metropolitan) The plot in the figure is a:
(Multiple Choice)
4.9/5 (35)
The standard deviation of the sample is used to estimate the standard deviation of the population.
(True/False)
5.0/5 (44)
Why does one divide by N - 1 rather than by N when estimating a population standard deviation from the sample standard deviation?
(Multiple Choice)
4.8/5 (31)
The second step in conducting the single-sample t test involves _____ and _____.
(Multiple Choice)
4.8/5 (40)
The correct formula for the upper bound of a confidence interval for a single-sample t test is:
(Multiple Choice)
4.8/5 (33)
Assume that the national credit card interest rate is 12.83 percent.A study of 81 college students finds that their average interest rate is 15 percent with a standard deviation of 8.7 percent.What is the 95 percent confidence interval for this single-sample t test?
(Multiple Choice)
4.9/5 (35)
Effect size measures have a different meaning for the t test than they do for the z test.
(True/False)
4.7/5 (37)
The single-sample t test compares the mean of a sample to a population for which the mean but not the standard deviation is known.
(True/False)
4.9/5 (39)
The numerator (top portion) of the ratio for calculating all t statistics contains:
(Multiple Choice)
4.7/5 (34)
What is the correct formula for using the sample standard deviation to estimate the population standard deviation?
(Multiple Choice)
4.9/5 (38)
Filters
- Essay(0)
- Multiple Choice(0)
- Short Answer(0)
- True False(0)
- Matching(0)