Exam 16: Regression
Exam 1: An Introduction to Statistics and Research Design156 Questions
Exam 2: Frequency Distributions89 Questions
Exam 3: Visual Displays of Data108 Questions
Exam 4: Central Tendency and Variability108 Questions
Exam 5: Sampling and Probability145 Questions
Exam 6: The Normal Curve, Standardization and Z Scores142 Questions
Exam 7: Hypothesis Testing With Z Tests141 Questions
Exam 8: Confidence Intervals, Effect Size, and Statistical Power147 Questions
Exam 9: The Single-Sample T Test124 Questions
Exam 10: The Paired-Samples T Test101 Questions
Exam 11: The Independent-Samples T Test99 Questions
Exam 12: One-Way Between-Groups Anova108 Questions
Exam 13: One-Way Within-Groups Anova102 Questions
Exam 14: Two-Way Between-Groups Anova115 Questions
Exam 15: Correlation139 Questions
Exam 16: Regression113 Questions
Exam 17: Chi-Square Tess120 Questions
Exam 18: Choosing and Reporting Statistics105 Questions
Select questions type
The simple linear regression equation uses the following formula: Ŷ = a + b(X).
(True/False)
4.7/5  (44)
(44)
Which statement about the slope of the simple linear regression line is true?
(Multiple Choice)
4.9/5 (42)
Structural equation modeling graphs depict a _____ among several variables, demonstrating how all of the variables combine to create a _____.
(Multiple Choice)
4.7/5 (31)
Good physical fitness has been correlated with many medical benefits, particularly in relation to blood pressure.A regression equation predicting an individual's blood pressure based on physical fitness level results in a negatively sloped line of best fit.What does this statement mean?
(Multiple Choice)
4.9/5 (36)
The predicted z score on the dependent variable will always be closer to the z score for the independent variable than its mean.
(True/False)
4.7/5 (33)
Assume a positive correlation is found between the number of hours students spend studying for an exam and their grade on the exam.If the regression equation for these data is calculated and the y intercept is 65, what conclusion can be drawn?
(Multiple Choice)
4.9/5 (34)
The intercept is the predicted value for X when Y is equal to 0.
(True/False)
4.8/5 (40)
Body weight can be predicted based on the amount of calories consumed by an individual due to the positive correlation between the two variables.When looking at the line of best fit for the linear regression, the data points are clustered close together.Predicted shyness based on the number of friendships a person has is also correlated, but the data points are more scattered around the line of best fit, showing a general negative correlation.Which has the higher predictive power and why?
(Multiple Choice)
4.7/5 (36)
Multiple regression differs from simple linear regression because it:
(Multiple Choice)
5.0/5 (35)
The predicted z score on the dependent variable will always be closer to its mean than the z score for the independent variable.
(True/False)
4.9/5 (29)
If the points on a scatterplot are all far away from the regression line:
(Multiple Choice)
4.8/5 (37)
Use the following to answer questions
The scatterplot and regression line on the left depict the relation between a state's expenditure per student and the average SAT scores for students in the state.The scatterplot and regression line on the right depict the relation between students' SAT Verbal and SAT Quantitative scores.
Figure: Standard Error Comparisons 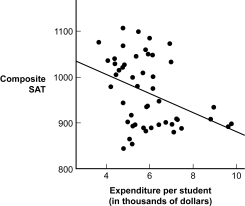
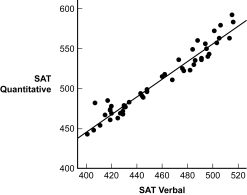 -(Figure: Standard Error Comparisons) Based on the scatterplots, for which prediction is the r2 greater?
(Multiple Choice)
4.9/5 (39)
In the computer printouts presented in the text, information for the multiple regression equation can be found in the column labeled:
(Multiple Choice)
4.8/5 (34)
The statistic that describes the variability of a set of data points to the line of best fit in a linear regression is the standard:
(Multiple Choice)
4.7/5 (40)
Data from 147 colleges from 1995 to 2005 (Lee, 2008) were used to predict the endowments (in billions) to a college from the average SAT score of students attending the college.The resulting regression equation was Ŷ = -20.46 + 4.06(X).This regression indicates that:
(Multiple Choice)
4.9/5 (45)
A multiple regression analysis revealed the following equation relating the time (in hours) it takes to complete a puzzle based on the number and size of pieces: Ŷ = 1.5 + 0.014 (Xnumber of pieces) - 1.2 (Ysize of pieces).If a puzzle has 1000 pieces, with a size value of 0.5 inches, how long will it take to complete?
(Multiple Choice)
4.7/5 (42)
The idea that patterns of extreme scores will balance out if sampling continues indefinitely or trends are looked at over the long run is known as:
(Multiple Choice)
4.7/5 (31)
Filters
- Essay(0)
- Multiple Choice(0)
- Short Answer(0)
- True False(0)
- Matching(0)