Exam 16: Regression
Exam 1: An Introduction to Statistics and Research Design156 Questions
Exam 2: Frequency Distributions89 Questions
Exam 3: Visual Displays of Data108 Questions
Exam 4: Central Tendency and Variability108 Questions
Exam 5: Sampling and Probability145 Questions
Exam 6: The Normal Curve, Standardization and Z Scores142 Questions
Exam 7: Hypothesis Testing With Z Tests141 Questions
Exam 8: Confidence Intervals, Effect Size, and Statistical Power147 Questions
Exam 9: The Single-Sample T Test124 Questions
Exam 10: The Paired-Samples T Test101 Questions
Exam 11: The Independent-Samples T Test99 Questions
Exam 12: One-Way Between-Groups Anova108 Questions
Exam 13: One-Way Within-Groups Anova102 Questions
Exam 14: Two-Way Between-Groups Anova115 Questions
Exam 15: Correlation139 Questions
Exam 16: Regression113 Questions
Exam 17: Chi-Square Tess120 Questions
Exam 18: Choosing and Reporting Statistics105 Questions
Select questions type
Use the following to answer questions
The scatterplot and regression line on the left depict the relation between a state's expenditure per student and the average SAT scores for students in the state.The scatterplot and regression line on the right depict the relation between students' SAT Verbal and SAT Quantitative scores.
Figure: Standard Error Comparisons 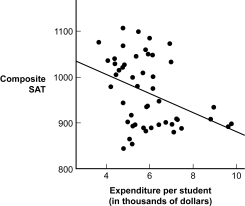
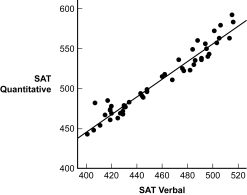 -(Figure: Standard Error Comparisons) For which prediction is the standard error of the estimate greater?
(Multiple Choice)
4.9/5  (35)
(35)
If two variables, independently, can help predict the outcome of a third variable, they are:
(Multiple Choice)
4.8/5 (36)
The simple linear regression equation uses the following formula: Ŷ = a(X) + b.
(True/False)
4.9/5 (38)
What information do the slopes in a multiple regression equation provide about the correlation coefficient?
(Multiple Choice)
4.8/5 (33)
A researcher wants to be able to predict first-semester grade point average with as much accuracy as possible, so she would like to use both high school grade point average and SAT score as predictor variables.Which technique would be most appropriate to make this prediction?
(Multiple Choice)
5.0/5 (36)
It is inappropriate to use structural equation modeling if there is not an a priori theoretical idea regarding the pattern of relations among the variables being measured.
(True/False)
4.9/5 (38)
Data from the World Health Organization in 2013 were used to predict the life expectancy for men in a country from the life expectancy of women in the country.The resulting regression equation was Ŷ = 3.73 + 0.88(X).This regression equation implies that:
(Multiple Choice)
4.9/5 (37)
The predicted z score for the dependent variable will always be _____ the individual's z score for the independent variable.
(Multiple Choice)
4.8/5 (30)
Filters
- Essay(0)
- Multiple Choice(0)
- Short Answer(0)
- True False(0)
- Matching(0)