Exam 16: Time-Series Forecasting and Index Numbers
Exam 1: Introduction and Data Collection137 Questions
Exam 2: Presenting Data in Tables and Charts181 Questions
Exam 3: Numerical Descriptive Measures138 Questions
Exam 4: Basic Probability152 Questions
Exam 5: Some Important Discrete Probability Distributions174 Questions
Exam 6: The Normal Distribution and Other Continuous Distributions180 Questions
Exam 7: Sampling Distributions and Sampling180 Questions
Exam 8: Confidence Interval Estimation185 Questions
Exam 9: Fundamentals of Hypothesis Testing: One-Sample Tests180 Questions
Exam 10: Two-Sample Tests184 Questions
Exam 11: Analysis of Variance179 Questions
Exam 12: Chi-Square Tests and Nonparametric Tests206 Questions
Exam 13: Simple Linear Regression196 Questions
Exam 14: Introduction to Multiple Regression258 Questions
Exam 15: Multiple Regression Model Building88 Questions
Exam 16: Time-Series Forecasting and Index Numbers193 Questions
Exam 17: Decision Making127 Questions
Exam 18: Statistical Applications in Quality Management113 Questions
Exam 19: Statistical Analysis Scenarios and Distributions82 Questions
Select questions type
TABLE 16-6
The number of cases of merlot wine sold by a Paso Robles winery in an 8-year period follows.
1991 270 1992 356 1993 398 1994 456 1995 358 1996 500 1997 410 1998 376
-Referring to Table 16-6, exponential smoothing with a weight or smoothing constant of 0.4 will be used to smooth the wine sales. The value of E2, the smoothed value for 1992 is______
(Short Answer)
4.7/5  (40)
(40)
In selecting a forecasting model, we should perform a residual analysis.
(True/False)
4.9/5 (32)
Which of the following statements about moving averages is not true?
(Multiple Choice)
4.8/5 (35)
TABLE 16-5
A contractor developed a multiplicative time-series model to forecast the number of contracts in future quarters, using quarterly data on number of contracts during the 3-year period from 1996 to 1998. The following is the resulting regression equation:
ln Y^ = 3.37 + 0.117 X - 0.083 Q1 + 1.28 Q2 + 0.617 Q3
where
Y^ is the estimated number of contracts in a quarter
X is the coded quarterly value with X = 0 in the first quarter of 1996.
Q1 is a dummy variable equal to 1 in the first quarter of a year and 0 otherwise.
Q2 is a dummy variable equal to 1 in the second quarter of a year and 0 otherwise.
Q3 is a dummy variable equal to 1 in the third quarter of a year and 0 otherwise.
-Referring to Table 16-5, the best interpretation of the coefficient of X (0.117) in the regression equation is
(Multiple Choice)
4.9/5 (39)
The Laspeyres price index is a form of weighted aggregate price index.
(True/False)
4.9/5 (29)
TABLE 16-6
The number of cases of merlot wine sold by a Paso Robles winery in an 8-year period follows.
1991 270 1992 356 1993 398 1994 456 1995 358 1996 500 1997 410 1998 376
-Referring to Table 16-6, the Holt-Winters method for forecasting with smoothing constant of 0.2 for both level and trend will be used to forecast the wine sales. The forecast for 2002 is _____.
(Short Answer)
4.7/5 (37)
For a price index, it is preferable to select the base period in a period of economic stability.
(True/False)
4.8/5 (35)
TABLE 16-10
The manager of a marketing consulting firm has been examining his company's yearly profits. He believes that these profits have been showing a quadratic trend since 1980. He uses Microsoft Excel to obtain the partial output below. The dependent variable is profit (in thousands of dollars), while the independent variables are coded years and squared of coded years, where 1980 is coded as 0, 1981 is coded as 1, etc.
Regression Statistics Multiple R 0.998 RSquare 0.996 Adjusted R Square 0.996 Standard Error 4.996 Observations 17
Coefficients Intercept 35.5 Coded Year 0.45 YearSquared 1.00
-Referring to Table 16-10, the fitted value for 1980 is____ .
(Short Answer)
4.9/5 (32)
TABLE 16-7
The number of passengers arriving at San Francisco on the Amtrak cross-country express on 6 successive Mondays were: 60, 72, 96, 84, 36, and 48.
-Referring to Table 16-7, the Holt-Winters method for forecasting with smoothing constant of 0.3 for both level and trend will be used to forecast the number of arrivals. The forecast for the twelfth Monday is _____.
(Short Answer)
5.0/5 (30)
TABLE 16-12
The manager of a health club has recorded average attendance in newly introduced step classes over the last 15 months: 32.1, 39.5, 40.3, 46.0, 65.2, 73.1, 83.7, 106.8, 118.0, 133.1, 163.3, 182.8, 205.6, 249.1, and 263.5. She then used Microsoft Excel to
obtain the following partial output for both a first- and second-order autoregressive model.
SUMMARY OUTPUT - 2nd Order Model
Regression Statistics
Multiple R 0.993 R Square 0.987 Adjusted R Square 0.985 Standard Error 9.276 Observations 15
Coefficients Intercept 5.86 XVariable 1 0.37 X Variable 2 0.85 \text {SUMMARY OUTPUT - 1 ^ { \text {st } } Order}
Multiple R 0.993 R Square 0.987 Adjusted R Square 0.985 Standard Error 9.150 Observations 15 Coefficients Intercept 5.66 XVariable 1.10
-Referring to Table 16-12, using the first-order model, the forecast of average attendance for month 17 is ______.
(Short Answer)
4.7/5 (30)
TABLE 16-15
Given below are the prices of a basket of four food items from 1996 to 2000.
Year Wheat (\ / Bushel ) Corn (\ / Bushel ) Soybeans (\ / Bushel ) Milk (\ / hundredweight) 1996 4.25 3.71 7.41 15.03 1997 3.43 27 7.55 13.63 1998 2.63 23 6.05 15.18 1999 2.11 1.97 4.68 14.72 2000 2.16 1.9 4.81 12.32
-Referring to Table 16-15, what is the Laspeyres price index for the basket of four food items in 2000 that consisted of 50 bushels of wheat, 30 bushels of corn, 40 bushels of soybeans and 80 hundredweight of milk in 1996 using 1996 as the base year?
(Short Answer)
4.8/5 (42)
After estimating a trend model for annual time-series data, you obtain the following residual plot against time, the problem with your model is that 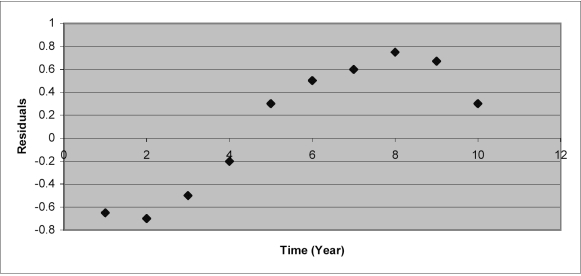
(Multiple Choice)
4.9/5 (36)
TABLE 16-14
Given below are the average prices for three types of energy products in the United States from 1992 to 1995.
Year Electricity N atural Gas Fuel Oil 1992 43.205 25.893 0.892 1993 16.959 28.749 0.969 1994 47.202 28.933 1.034 1995 48.874 29.872 0.913 1996 48.693 28.384 0.983
-Referring to Table 16-14, what is the unweighted aggregate price index for the group of three energy items in 1995 using 1992 as the base year?
(Short Answer)
4.8/5 (26)
TABLE 16-11
Business closures in Laramie, Wyoming from 1989 to 1994 were:
1993 10 1994 11 1995 13 1996 19 1997 24 1998 35 Microsoft Excel was used to fit both first-order and second-order autoregressive models, resulting in the following partial outputs:
\text {SUMMARY OUTPUT - 2^ { \text {nd } }Order M odel}
Intercept -5.77 X Variable 1 0.80 X Variable 2 1.14
\text {SUMMARY OUTPUT - st Order Model ^ { \text {st } } OP}
Intercept XVariable 1 1.59
-Referring to Table 16-11, the value of the MAD for the second-order autoregressive model is ____.
(Short Answer)
4.8/5 (40)
TABLE 16-13
A local store developed a multiplicative time-series model to forecast its revenues in future quarters, using quarterly data on its revenues during the 4-year period from 1998 to 2002. The following is the resulting regression equation:
log10Y^ = 6.102 + 0.012 X - 0.129 Q1 - 0.054 Q2 + 0.098 Q3
where
Y^ is the estimated number of contracts in a quarter
X is the coded quarterly value with X = 0 in the first quarter of 1998.
Q1 is a dummy variable equal to 1 in the first quarter of a year and 0 otherwise.
Q2 is a dummy variable equal to 1 in the second quarter of a year and 0 otherwise.
Q3 is a dummy variable equal to 1 in the third quarter of a year and 0 otherwise.
-Referring to Table 16-13, in testing the significance of the coefficient for Q1 in the regression equation (- 0.129) which has a p-value of 0.492. Which of the following is the best interpretation of this result?
(Multiple Choice)
4.9/5 (30)
TABLE 16-14
Given below are the average prices for three types of energy products in the United States from 1992 to 1995.
Year Electricity N atural Gas Fuel Oil 1992 43.205 25.893 0.892 1993 16.959 28.749 0.969 1994 47.202 28.933 1.034 1995 48.874 29.872 0.913 1996 48.693 28.384 0.983
-Referring to Table 16-14, what is the Paasche price index for the group of three energy items in 1994 for a family that consumed 13 units of electricity, 26 unites of natural gas and 235 units of fuel oil in 1994 using 1992 as the base year?
(Short Answer)
4.9/5 (40)
TABLE 16-15
Given below are the prices of a basket of four food items from 1996 to 2000.
Wheat Corn Soybeans Milk Year ( \/ Bushel) ( \/ Bushel) ( \/ Bushel) ( \/ hundredweight) 1996 4.25 3.71 7.41 15.03 1997 3.43 27 7.55 13.63 1998 2.63 23 6.05 15.18 1999 2.11 1.97 4.68 14.72
2000 2.16 1.9 4.81 12.32
-Referring to Table 16-15, what are the simple price indexes for wheat, corn, soybeans and milk, respectively, in 1998 using 1996 as the base year?
(Short Answer)
4.9/5 (37)
TABLE 16-9
The executive vice-president of a drug manufacturing firm believes that the demand for the firm's most popular drug has been evidencing an exponential trend since 1985. She uses Microsoft Excel to obtain the partial output below. The dependent variable is the log base 10 of the demand for the drug, while the independent variable is years, where 1985 is coded as 0, 1986 is coded as 1, etc.
Regression Statistics Multiple R 0.996 R Square 0.992 Adjusted R Square 0.991 Standard Error 0.02831 Observations 12
Coefficients Intercept 1.44 Coded Year 0.068
-Referring to Table 16-9, the fitted trend value for 1990 is _____.
(Short Answer)
4.8/5 (39)
TABLE 16-7
The number of passengers arriving at San Francisco on the Amtrak cross-country express on 6 successive Mondays were: 60, 72, 96, 84, 36, and 48.
-Referring to Table 16-7, the number of arrivals will be exponentially smoothed with a smoothing constant of 0.1. Then the forecast for the seventh Monday will be ____.
(Short Answer)
4.8/5 (28)
In selecting an appropriate forecasting model, the following approach is suggested:
(Multiple Choice)
4.9/5 (29)
Filters
- Essay(0)
- Multiple Choice(0)
- Short Answer(0)
- True False(0)
- Matching(0)