Exam 10: Two-Sample Tests
Exam 1: Introduction and Data Collection137 Questions
Exam 2: Presenting Data in Tables and Charts181 Questions
Exam 3: Numerical Descriptive Measures138 Questions
Exam 4: Basic Probability152 Questions
Exam 5: Some Important Discrete Probability Distributions174 Questions
Exam 6: The Normal Distribution and Other Continuous Distributions180 Questions
Exam 7: Sampling Distributions and Sampling180 Questions
Exam 8: Confidence Interval Estimation185 Questions
Exam 9: Fundamentals of Hypothesis Testing: One-Sample Tests180 Questions
Exam 10: Two-Sample Tests184 Questions
Exam 11: Analysis of Variance179 Questions
Exam 12: Chi-Square Tests and Nonparametric Tests206 Questions
Exam 13: Simple Linear Regression196 Questions
Exam 14: Introduction to Multiple Regression258 Questions
Exam 15: Multiple Regression Model Building88 Questions
Exam 16: Time-Series Forecasting and Index Numbers193 Questions
Exam 17: Decision Making127 Questions
Exam 18: Statistical Applications in Quality Management113 Questions
Exam 19: Statistical Analysis Scenarios and Distributions82 Questions
Select questions type
TABLE 10-6
Two samples each of size 25 are taken from independent populations assumed to be normally distributed with equal variances. The first sample has a mean of 35.5 and standard deviation of 3.0 while the second sample has a mean of 33.0 and standard deviation of 4.0.
-Referring to Table 10-6, there are____ degrees of freedom for this test.
(Short Answer)
4.9/5  (35)
(35)
When testing for differences between the means of two related populations, we can use either a one-tailed or two-tailed test.
(True/False)
4.8/5 (35)
TABLE 10-7
To investigate the efficacy of a diet, a random sample of 16 male patients is drawn from a population of adult males using the diet. The weight of each individual in the sample is taken at the start of the diet and at a medical follow-up 4 weeks later. Assuming that the population of differences in weight before versus after the diet follow a normal distribution, the t-test for related samples can be used to determine if there was a significant decrease in the mean weight during this period. Suppose the mean decrease in weights over all 16 subjects in the study is 3.0 pounds with the standard deviation of differences computed as 6.0 pounds.
-Referring to Table 10-7, the p-value for a one-tailed test whose computed t statistic is 2.00 is between____ and________ .
(Short Answer)
4.8/5 (33)
TABLE 10-6
Two samples each of size 25 are taken from independent populations assumed to be normally distributed with equal variances. The first sample has a mean of 35.5 and standard deviation of 3.0 while the second sample has a mean of 33.0 and standard deviation of 4.0.
-Referring to Table 10-6, the pooled (i.e., combined) variance is _____.
(Short Answer)
4.9/5 (38)
TABLE 10-11
A corporation randomly selects 150 salespeople and finds that 66% who have never taken a self-improvement course would like such a course. The firm did a similar study 10 years ago in which 60% of a random sample of 160 salespeople wanted a self-improvement course. The groups are assumed to be independent random samples. Let ×and × represent the true proportion of workers who would like to attend a self-improvement course in the recent study and the past study, respectively.
-Referring to Table 10-11, if the firm wanted to test whether this proportion has changed from the previous study, which represents the relevant hypotheses?
(Multiple Choice)
4.9/5 (35)
TABLE 10-8
A buyer for a manufacturing plant suspects that his primary supplier of raw materials is overcharging. In order to determine if his suspicion is correct, he contacts a second supplier and asks for the prices on various identical materials. He wants to compare these prices with those of his primary supplier. The data collected is presented in the table below, with some summary statistics presented (all of these might not be necessary to answer the questions which follow). The buyer believes that the differences are normally distributed and will use this sample to perform an appropriate test at a level of significance of 0.01.
Primary Secondary 1 \ 55 \ 45 \ 10 2 \ 48 \ 47 \ 1 3 \ 31 \ 32 -\ 1 4 \ 83 \ 77 \ 6 5 \ 37 \ 37 \ 0 6 \ 55 \ 54 \ 1 Sum: \ 309 \ 292 \ 17 Sum of Squares: \ 17,573 \ 15,472 \ 139
-Referring to Table 10-8, what is the 90% confidence interval estimate for the mean difference in prices?
(Short Answer)
4.7/5 (33)
The t test for the difference between the means of two independent populations assumes that the respective
(Multiple Choice)
4.9/5 (35)
The test for the equality of two population variances is based on
(Multiple Choice)
4.8/5 (46)
TABLE 10-12
The dean of a college is interested in the proportion of graduates from his college who have a job offer on graduation day. He is particularly interested in seeing if there is a difference in this proportion for accounting and economics majors. In a random sample of 100 of each type of major at graduation, he found that 65 accounting majors and 52 economics majors
had job offers. If the accounting majors are designated as "Group 1" and the economics majors are designated as "Group 2," perform the appropriate hypothesis test using a level of significance of 0.05.
-Referring to Table 10-12, construct a 95% confidence interval estimate of the difference in proportion between accounting majors and economic majors who have a job offer on graduation day.
(Short Answer)
4.7/5 (38)
TABLE 10-14
A problem with a telephone line that prevents a customer from receiving or making calls is disconcerting to both the customer and the telephone company. The data on samples of 20 problems reported to two different offices of a telephone company and the time to clear these problems (in minutes) from the customers' lines are collected. Below is the Excel output to see whether there is evidence of a difference in the mean waiting time between the two offices assuming that the population variances in the two offices are not equal.
t- Test: Two- Sample Assuming Unequal Variances Office 1 Office 2 Mean 2214 2.0115 Variance 2.951657 3.57855 Observations 20 20 Hypothesized Mean Difference 0 38 Stat 0.354386 (<=) one- tail 0.362504 Critical one- tail 1.685953 (<=) two- tail 0.725009 Critical two- tail 2.024394
-Referring to Table 10-14, what is the smallest level of significance at which the null hypothesis will still not be rejected?
(Multiple Choice)
4.8/5 (34)
TABLE 10-14
A problem with a telephone line that prevents a customer from receiving or making calls is disconcerting to both the customer and the telephone company. The data on samples of 20 problems reported to two different offices of a telephone company and the time to clear these problems (in minutes) from the customers' lines are collected. Below is the Excel output to see whether there is evidence of a difference in the mean waiting time between the two offices assuming that the population variances in the two offices are not equal.
t- Test: Two- Sample Assuming Unequal Variances Office 1 Office 2 Mean 2214 2.0115 Variance 2.951657 3.57855 Observations 20 20 Hypothesized Mean Difference 0 38 Stat 0.354386 (<=) one- tail 0.362504 Critical one- tail 1.685953 (<=) two- tail 0.725009 Critical two- tail 2.024394
-Referring to Table 10-14, suppose ? = 0.05. Which of the following represents the result of the relevant hypothesis test?
(Multiple Choice)
4.8/5 (41)
TABLE 10-13
A quality control engineer is in charge of the manufacture of computer disks. Two different processes can be used to manufacture the disks. He suspects that the Kohler method produces a greater proportion of defects than the Russell method. He samples 150 of the Kohler and 200 of the Russell disks and finds that 27 and 18 of them, respectively, are defective. If Kohler is designated as "Group 1" and Russell is designated as "Group 2," perform the appropriate test at a level of significance of 0.01.
-Referring to Table 10-13, construct a 90% confidence interval estimate of the difference in proportion between the Kohler and Russell disks that are defective.
(Short Answer)
4.8/5 (35)
If we wish to determine whether there is evidence that the proportion of items of interest is higher in Group 1 than in Group 2, and the test statistic for Z = - 2.07 where the difference is defined as Group 1's proportion minus Group 2's proportion, the p-value is equal to____
.
(Short Answer)
4.9/5 (39)
A buyer for a manufacturing plant suspects that his primary supplier of raw materials is overcharging. In order to determine if his suspicion is correct, he contacts a second supplier and asks for the prices on various identical materials. He wants to compare these prices with those of his primary supplier. The data collected is presented in the table below, with some summary statistics presented (all of these might not be necessary to answer the questions which follow). The buyer believes that the differences are normally distributed and will use this sample to perform an appropriate test at a level of significance of 0.01.
Primary Secondary 1 \ 55 \ 45 \ 10 2 \ 48 \ 47 \ 1 3 \ 31 \ 32 -\ 1 4 \ 83 \ 77 \ 6 5 \ 37 \ 37 \ 0 6 \ 55 \ 54 \ 1 Sum: \ 309 \ 292 \ 17
-Referring to Table 10-8, the buyer should decide that the primary supplier is
(Multiple Choice)
4.9/5 (34)
TABLE 10-3
The use of preservatives by food processors has become a controversial issue. Suppose 2 preservatives are extensively tested and determined safe for use in meats. A processor wants to compare the preservatives for their effects on retarding spoilage. Suppose 15 cuts of fresh meat are treated with preservative I and 15 are treated with preservative II, and the number of hours until spoilage begins is recorded for each of the 30 cuts of meat. The results are summarized in the table below.
Preservative A Preservative B =106.4 hours =96.54 hours =10.3 hours =13.4 hours
-Referring to Table 10-3, state the null and alternative hypotheses for testing if the population variances differ for preservatives I and II.
(Multiple Choice)
4.8/5 (41)
TABLE 10-7
To investigate the efficacy of a diet, a random sample of 16 male patients is drawn from a population of adult males using the diet. The weight of each individual in the sample is taken at the start of the diet and at a medical follow-up 4 weeks later. Assuming that the population of differences in weight before versus after the diet follow a normal distribution, the t-test for related samples can be used to determine if there was a significant decrease in the mean weight during this period. Suppose the mean decrease in weights over all 16 subjects in the study is 3.0 pounds with the standard deviation of differences computed as 6.0 pounds.
-Referring to Table 10-7, the p-value for a two-tailed test whose computed statistic is 2.00 is between____ .
(Short Answer)
4.9/5 (44)
TABLE 10-14
A problem with a telephone line that prevents a customer from receiving or making calls is disconcerting to both the customer and the telephone company. The data on samples of 20 problems reported to two different offices of a telephone company and the time to clear these problems (in minutes) from the customers' lines are collected. Below is the Excel output to see whether there is evidence of a difference in the mean waiting time between the two offices assuming that the population variances in the two offices are not equal.
t- Test: Two- Sample Assuming Unequal Variances Office 1 Office 2 Mean 2214 2.0115 Variance 2.951657 3.57855 Observations 20 20 Hypothesized Mean Difference 0 38 Stat 0.354386 (<=) one- tail 0.362504 Critical one- tail 1.685953 (<=) two- tail 0.725009 Critical two- tail 2.024394
-Referring to Table 10-14, what is the standardized value of the estimate of the mean of the sampling distribution for the difference between sample means?
(Multiple Choice)
4.9/5 (30)
TABLE 10-1
Are Japanese managers more motivated than American managers? A randomly selected group of each were administered
the Sarnoff Survey of Attitudes Toward Life (SSATL), which measures motivation for upward mobility. The SSATL scores are summarized below.
American Japanese Sample Size 211 100 Mean SSATL Score 65.75 79.83 Population Std. Dev. 11.07 6.41
-Referring to Table 10-1, judging from the way the data were collected, which test would likely be most appropriate to employ?
(Multiple Choice)
4.9/5 (39)
In testing for differences between the means of two related populations where the variance of the differences is unknown, the degrees of freedom are
(Multiple Choice)
5.0/5 (33)
TABLE 10-10
The following EXCEL output contains the results of a test to determine if the proportions of satisfied guests at two resorts are the same or different.
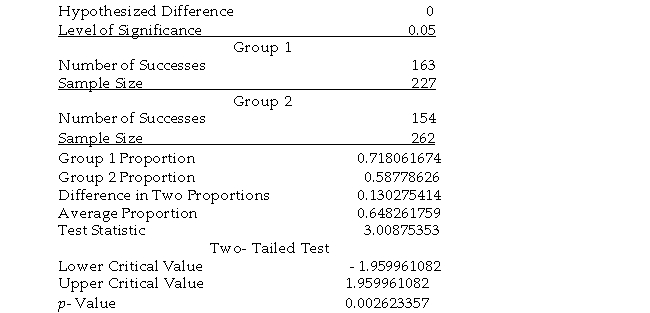 -Referring to Table 10-10, if you want to test the claim that "Resort 1 (Group 1) has a higher proportion of satisfied guests compared to Resort 2 (Group 2)," the p-value of the test will be
(Multiple Choice)
4.7/5 (37)
Filters
- Essay(0)
- Multiple Choice(0)
- Short Answer(0)
- True False(0)
- Matching(0)