Exam 3: Data Visualization
Exam 1: Introduction35 Questions
Exam 2: Descriptive Statistics65 Questions
Exam 3: Data Visualization47 Questions
Exam 4: Descriptive Data Mining44 Questions
Exam 5: Probability: an Introduction to Modeling Uncertainty36 Questions
Exam 6: Statistical Inference47 Questions
Exam 7: Linear Regression46 Questions
Exam 8: Time Series Analysis and Forecasting41 Questions
Exam 9: Predictive Data Mining38 Questions
Exam 10: Spreadsheet Models49 Questions
Exam 11: Monte Carlo Simulation41 Questions
Exam 12: Linear Optimization Models38 Questions
Exam 13: Integer Linear Optimization Models42 Questions
Exam 14: Nonlinear Optimization Models46 Questions
Exam 15: Decision Analysis40 Questions
Select questions type
The charts that are helpful in making comparisons between categorical variables are
(Multiple Choice)
4.8/5  (32)
(32)
This bar chart displays the demographics of a Business Analysis class. How many male students are in the class? 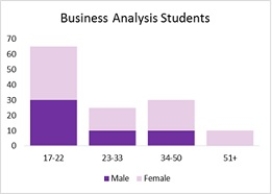
(Multiple Choice)
4.7/5 (40)
The data dashboard for a marketing manager may have KPIs related to
(Multiple Choice)
4.8/5 (41)
Which of the following graphs cannot be used to display categorical data?
(Multiple Choice)
4.9/5 (35)
To summarize and analyze data with both a crosstabulation and charting, Excel typically pairs
(Multiple Choice)
4.9/5 (30)
A _____________ is a graphical presentation of the relationship between two quantitative variables.
(Multiple Choice)
4.9/5 (29)
Construct a scatter chart for the following set of data. Describe the relationship between the two variables.
V AR1 2 5 6 7 10 VAR2 3 6 8 13 15
(Essay)
5.0/5 (33)
Consider the clustered bar chart of the dashboard developed to monitor the performance of a call center: 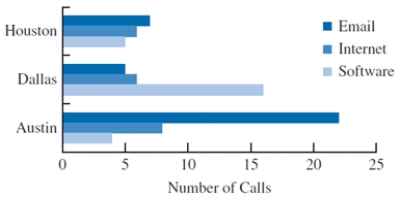 This chart allows the IT manager to
(Multiple Choice)
4.8/5 (39)
Deleting the grid lines in a table and the horizontal lines in a chart
(Multiple Choice)
4.8/5 (33)
Using multiple lines on a line chart or employing multiple charts is an alternative to a
(Multiple Choice)
4.8/5 (39)
The ratio of the amount of ink used in a table or chart that is necessary to convey information to the total amount of ink used in the table and chart is known as data-ink ratio. Using additional ink that is not necessary to convey information has what effect on the data-ink ratio?
(Multiple Choice)
4.9/5 (38)
An effective display of trend and magnitude is achieved by using a combination of a
(Multiple Choice)
4.7/5 (33)
The software package most commonly used for creating simple charts is
(Multiple Choice)
4.8/5 (41)
Filters
- Essay(0)
- Multiple Choice(0)
- Short Answer(0)
- True False(0)
- Matching(0)