Exam 2: Graphical Descriptive Techniques I
Exam 1: What Is Statistics43 Questions
Exam 2: Graphical Descriptive Techniques I93 Questions
Exam 3: Graphical Descriptive Techniques II140 Questions
Exam 4: Numerical Descriptive Techniques316 Questions
Exam 5: Data Collection and Sampling82 Questions
Exam 6: Probability237 Questions
Exam 7: Random Variables and Discrete Probability Distributions277 Questions
Exam 8: Continuous Probability Distributions215 Questions
Exam 9: Sampling Distributions154 Questions
Exam 10: Introduction to Estimation152 Questions
Exam 11: Introduction to Hypothesis Testing187 Questions
Exam 12: Inference About a Population149 Questions
Exam 13: Inference About Comparing Two Populations168 Questions
Exam 14: Analysis of Variance157 Questions
Exam 15: Chi-Squared Tests Optional175 Questions
Exam 16: Simple Linear Regression and Correlation301 Questions
Exam 17: Multiple Regression158 Questions
Select questions type
We can summarize nominal data in a table that presents the categories and their counts. This table is called a(n) ____________________ distribution.
(Short Answer)
4.9/5  (37)
(37)
For each of the following examples, identify the data type as nominal, ordinal, or interval.
a.The final grade received by a student in a neuro-science class.
b.The number of students in a Physics course.
c.The starting salary of a PhD graduate.
d.The size of an order of fries (small, medium, large, super-size) purchased by a Burger King customer.
e.The college you are enrolled in (Arts and Sciences, Business, Education, etc.).
(Essay)
4.7/5 (37)
Using the following cross-classification table, draw two bar charts that compare pet ownership for males vs. females. Are gender and pet ownership related?
Own a pet Dan't awn a pet Females 75 25 Males 40 60
(Essay)
4.7/5 (35)
Suppose you measure the number of minutes it takes an employee to complete a task, where the maximum allowed time is 5 minutes, and each time is rounded to the nearest minute. Data from 130 employees is summarized below. How long did it take most employees to complete the task? Time (minutes) 1 2 3 4 5 Frequency 25 40 50 35 30
(Multiple Choice)
4.7/5 (24)
NARRBEGIN: Internet Classes
Internet Classes
A survey of 25 students was conducted to determine how they rate the quality of Internet classes. Students were asked to rate the overall quality from 0 (no quality at all) to 100 (extremely good quality). The stem-and-leaf display of the data is shown below. Stem Leaves 3 15 4 01457889 5 0134677 6 24568 7 29 8 9 5 NARREND
-If two nominal variables are unrelated, the patterns exhibited in their corresponding pie charts should be approximately the same. If a relationship exists, then some pie charts will differ from others.
(True/False)
4.8/5 (31)
Before leaving a particular restaurant, customers are asked to respond to the questions listed below. For each question, determine whether the possible responses are interval, nominal, or ordinal.
a.What is the approximate distance (in miles) between this restaurant and your residence?
b.Have you ever eaten at this restaurant before?
c.On how many occasions have you eaten at the restaurant before?
d.Which of the following attributes of this restaurant do you find most attractive: service, prices, quality of the food, or the menu?
e.What is your overall rating of the restaurant: excellent, good, fair, or poor?
(Essay)
4.8/5 (37)
A pie chart shows the ____________________ of individuals that fall into each category.
(Short Answer)
4.9/5 (37)
NARRBEGIN: Internet Classes
Internet Classes
A survey of 25 students was conducted to determine how they rate the quality of Internet classes. Students were asked to rate the overall quality from 0 (no quality at all) to 100 (extremely good quality). The stem-and-leaf display of the data is shown below. Stem Leaves 3 15 4 01457889 5 0134677 6 24568 7 29 8 9 5 NARREND
-A college professor classifies his students according to their grade point average (GPA) and their gender. The resulting cross-classification table is shown below. GPA Gender Under 2.0 2.0 - 3. 0 Over 3.0 Male 10 30 15 Female 15 25 35 If you made a pie chart for male GPAs and a pie chart for female GPAs, those pie charts would look the same.
(True/False)
4.8/5 (34)
NARRBEGIN: Internet Classes
Internet Classes
A survey of 25 students was conducted to determine how they rate the quality of Internet classes. Students were asked to rate the overall quality from 0 (no quality at all) to 100 (extremely good quality). The stem-and-leaf display of the data is shown below. Stem Leaves 3 15 4 01457889 5 0134677 6 24568 7 29 8 9 5 NARREND
-A survey of 100 adults was conducted to see if gender is related to pet ownership. The results are summarized in the bar chart below. Which of the following statements describes the relationship? 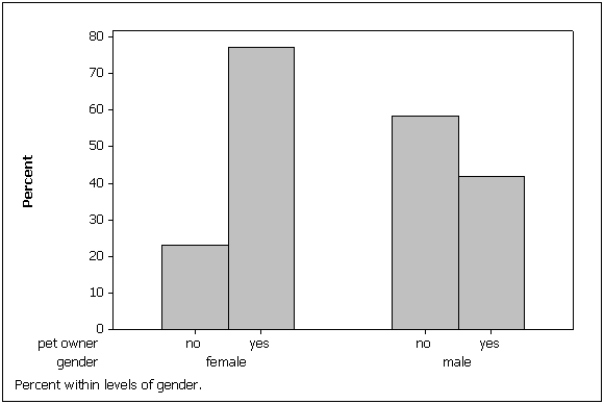
(Multiple Choice)
4.7/5 (38)
A(n) ____________________ chart is not able to show frequencies. It can only show relative frequencies.
(Short Answer)
4.8/5 (35)
NARRBEGIN: Internet Classes
Internet Classes
A survey of 25 students was conducted to determine how they rate the quality of Internet classes. Students were asked to rate the overall quality from 0 (no quality at all) to 100 (extremely good quality). The stem-and-leaf display of the data is shown below. Stem Leaves 3 15 4 01457889 5 0134677 6 24568 7 29 8 9 5 NARREND
-A cross-classification table summarizes data from two nominal variables.
(True/False)
4.7/5 (32)
A researcher wishes to estimate the textbook costs of first-year students at Barry University. To do so, he recorded the textbook cost of 300 first-year students and found that their average textbook cost was $195 per semester. The variable of interest to the researcher is
(Multiple Choice)
4.8/5 (36)
Which situation identifies when to use pie charts and/or bar charts?
(Multiple Choice)
4.9/5 (32)
One of the advantages of a pie chart is that it clearly shows that the total percentages of all the categories add to 100%.
(True/False)
4.8/5 (31)
NARRBEGIN: Internet Classes
Internet Classes
A survey of 25 students was conducted to determine how they rate the quality of Internet classes. Students were asked to rate the overall quality from 0 (no quality at all) to 100 (extremely good quality). The stem-and-leaf display of the data is shown below. Stem Leaves 3 15 4 01457889 5 0134677 6 24568 7 29 8 9 5 NARREND
-Data that contains information on two variables is called ____________________ data.
(Short Answer)
4.8/5 (31)
NARRBEGIN: Internet Classes
Internet Classes
A survey of 25 students was conducted to determine how they rate the quality of Internet classes. Students were asked to rate the overall quality from 0 (no quality at all) to 100 (extremely good quality). The stem-and-leaf display of the data is shown below. Stem Leaves 3 15 4 01457889 5 0134677 6 24568 7 29 8 9 5 NARREND
-When studying the responses to two nominal questions, we should develop a
(Multiple Choice)
4.8/5 (27)
A frequency distribution lists the categories and the proportion with which each occurs.
(True/False)
4.8/5 (31)
Filters
- Essay(0)
- Multiple Choice(0)
- Short Answer(0)
- True False(0)
- Matching(0)