Exam 2: Graphical Descriptive Techniques I
Exam 1: What Is Statistics43 Questions
Exam 2: Graphical Descriptive Techniques I93 Questions
Exam 3: Graphical Descriptive Techniques II140 Questions
Exam 4: Numerical Descriptive Techniques316 Questions
Exam 5: Data Collection and Sampling82 Questions
Exam 6: Probability237 Questions
Exam 7: Random Variables and Discrete Probability Distributions277 Questions
Exam 8: Continuous Probability Distributions215 Questions
Exam 9: Sampling Distributions154 Questions
Exam 10: Introduction to Estimation152 Questions
Exam 11: Introduction to Hypothesis Testing187 Questions
Exam 12: Inference About a Population149 Questions
Exam 13: Inference About Comparing Two Populations168 Questions
Exam 14: Analysis of Variance157 Questions
Exam 15: Chi-Squared Tests Optional175 Questions
Exam 16: Simple Linear Regression and Correlation301 Questions
Exam 17: Multiple Regression158 Questions
Select questions type
Car buyers were asked to indicate the car dealer they believed offered the best overall service. The four choices were Convoy Motors (C), Mako Chrysler (M), Torrent Auto (T), and Unequaled Chevrolet (U). The following data were obtained: T C C C U C M T C U U M C M T C M M C M T C C T U M M C C T T U C U T M M C U T What percentage of car buyers identified Convoy Motors as having the best overall service?
(Multiple Choice)
4.7/5  (39)
(39)
The Chief of Police conducted a survey of the officers on his squad. An officer's shooting score at target practice is an example of a(n) ____________________ variable.
(Short Answer)
4.8/5 (30)
Bar and pie charts are graphical techniques for nominal data. The former focus the attention on the frequency of the occurrences of each category, and the later emphasizes the proportion of occurrences of each category.
(True/False)
4.8/5 (29)
NARRBEGIN: Business Graduates
Business School Graduates
A sample of business school graduates were asked what their major was. The results are shown in the following frequency distribution. Major of Graduates Number of graduates Accounting 58 Finance 42 Manegement 38 Marketing 52 Other 10 NARREND
-{Business School Graduates Narrative} If you were only given the frequency bar chart below, would you able to reconstruct the original observations in the data set? 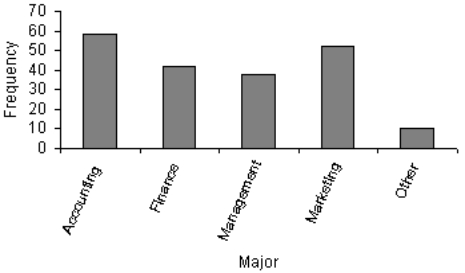
(Essay)
4.9/5 (36)
From a pie chart you are able to find the frequency for each category.
(True/False)
4.8/5 (39)
You cannot calculate and interpret differences between numbers assigned to nominal data.
(True/False)
4.9/5 (38)
A(n) ____________________ distribution lists the categories of a nominal variable and the proportion with which each occurs.
(Short Answer)
4.9/5 (34)
NARRBEGIN: All-Nighters
All-Nighters
A sample of 400 students at a certain university was taken after the midterm; 200 students reported staying up all night before the midterm and the other 200 students did not. Researchers recorded whether each student did well or poorly on the midterm. The following table contains the results. Did Well on Midterm Did Poorly on Midterm Stayed up all right 60 140 Did not stay up all night 120 80 NARREND
-{All-Nighters Narrative} Briefly explain (using percentages) whether staying up all night before this midterm is related to a student doing poorly.
(Essay)
4.9/5 (31)
NARRBEGIN: Business Graduates
Business School Graduates
A sample of business school graduates were asked what their major was. The results are shown in the following frequency distribution. Major of Graduates Number of graduates Accounting 58 Finance 42 Manegement 38 Marketing 52 Other 10 NARREND
-{Business School Graduates Narrative} How many graduates were surveyed?
(Essay)
4.8/5 (45)
Identify the type of data for which each of the following graphs is appropriate.
a.Pie chart
b.Bar chart
(Short Answer)
4.7/5 (32)
For what type of data are frequencies the only calculations that can be done?
(Multiple Choice)
4.8/5 (33)
NARRBEGIN: Business Graduates
Business School Graduates
A sample of business school graduates were asked what their major was. The results are shown in the following frequency distribution. Major of Graduates Number of graduates Accounting 58 Finance 42 Manegement 38 Marketing 52 Other 10 NARREND
-Suppose you measure the number of minutes it takes an employee to complete a task, where the maximum allowed time is 5 minutes, and each time is rounded to the nearest minute. Data from 130 employees is summarized below. Construct a frequency bar chart and a pie chart from this data. How long did it take most employees to complete the task?
Time (minutes) 1 2 3 4 5 Frequency 15 30 40 25 20
(Essay)
4.8/5 (41)
In purchasing a used computer, there are a number of variables to consider. The age of the computer is an example of a(n) ____________________ variable.
(Short Answer)
4.9/5 (27)
Filters
- Essay(0)
- Multiple Choice(0)
- Short Answer(0)
- True False(0)
- Matching(0)