Exam 4: Numerical Descriptive Techniques
Exam 1: What Is Statistics43 Questions
Exam 2: Graphical Descriptive Techniques I93 Questions
Exam 3: Graphical Descriptive Techniques II140 Questions
Exam 4: Numerical Descriptive Techniques316 Questions
Exam 5: Data Collection and Sampling82 Questions
Exam 6: Probability237 Questions
Exam 7: Random Variables and Discrete Probability Distributions277 Questions
Exam 8: Continuous Probability Distributions215 Questions
Exam 9: Sampling Distributions154 Questions
Exam 10: Introduction to Estimation152 Questions
Exam 11: Introduction to Hypothesis Testing187 Questions
Exam 12: Inference About a Population149 Questions
Exam 13: Inference About Comparing Two Populations168 Questions
Exam 14: Analysis of Variance157 Questions
Exam 15: Chi-Squared Tests Optional175 Questions
Exam 16: Simple Linear Regression and Correlation301 Questions
Exam 17: Multiple Regression158 Questions
Select questions type
NARRBEGIN: Test Scores
Test Scores
Suppose that an analysis of a set of test scores reveals that: Q1 = 45, Q2 = 85, Q3 = 105.NARREND
-{Test Scores Narrative} What do these statistics tell you about the shape of the distribution of test scores?
Free
(Essay)
4.8/5  (35)
(35)
Correct Answer: Verified
The fact that Q2 - Q1 = 40 is greater that Q3 -Q2 = 20 indicates that test scores are negatively skewed.
The ____________________ measures the margin of relative change in the dependent variable.
Free
(Short Answer)
4.8/5 (38)
Correct Answer:Verified
slope
The Empirical Rule states that the approximate percentage of measurements in a data set (providing that the data set has a bell shaped distribution) that fall within two standard deviations of their mean is approximately:
Free
(Multiple Choice)
4.8/5 (38)
Correct Answer:Verified
C
NARRBEGIN: Weights of Teachers
Weights of Teachers
The following data represent the weights in pounds of a sample of 25 teachers: 164, 148, 137, 157, 173, 156, 177, 172, 169, 165, 145, 168, 163, 162, 174, 152, 156, 168, 154, 151, 174, 146, 134, 140, and 171.NARREND
-Is it possible for the standard deviation of a data set to be larger than its variance? Explain.
(Essay)
4.7/5 (38)
The standard deviation is expressed in terms of the original units of measurement but the variance is not.
(True/False)
4.9/5 (26)
NARRBEGIN: Weights of Police Officer
Weights of Police Officers
The following data represent the weights in pounds of a sample of 25 police officers: 164, 148, 137, 157, 173, 156, 177, 172, 169, 165, 145, 168, 163, 162, 174, 152, 156, 168, 154, 151, 174, 146, 134, 140, and 171.NARREND
-{Weights of Police Officers Narrative} Construct a frequency distribution for the data, using five class intervals, and the value 130 as the lower limit of the first class.
(Essay)
4.9/5 (27)
NARRBEGIN: Test Scores
Test Scores
Suppose that an analysis of a set of test scores reveals that: Q1 = 45, Q2 = 85, Q3 = 105.NARREND
-{Test Scores Narrative} What can you say about the relative position of each of the observations 34, 84, and 104, within this data set?
(Essay)
4.8/5 (34)
Suppose that a firm's sales were $2,500,000 four years ago, and sales have grown annually by 25%, 15%, -5%, and 10% since that time. What was the geometric mean growth rate in sales over the past four years?
(Essay)
4.9/5 (30)
NARRBEGIN: Hours Worked per Week
Hours Worked per Week
The following data represent the hours worked per week of a sample of 25 employees from a government department: 31, 43, 56, 23, 49, 42, 33, 61, 44, 28, 48, 38, 44, 35, 40, 64, 52, 42, 47, 39, 53, 27, 36, 35, and 20.NARREND
-{Hours Worked per Week Narrative} Find the modal hours.
(Short Answer)
4.9/5 (34)
NARRBEGIN: Salaries of Office Worker
Salaries of Office Workers
The following data represent the salaries (in thousands of dollars) of a sample of 13 office workers of a firm: 26.5, 23.5, 29.7, 24.8, 21.1, 24.3, 20.4, 22.7, 27.2, 23.7, 24.1, 24.8, and 28.2.NARREND
-Consider the following population of measurements: 162, 152, 177, 157, 184, 176, 165, 181, 170, and 163. Label and compute the variance and standard deviation.
(Essay)
4.9/5 (42)
In a histogram, the proportion of the total area which must be to the left of the median is:
(Multiple Choice)
4.8/5 (40)
NARRBEGIN: 2-Year Investment
2-Year Investment
Suppose you make a 2-year investment of $5,000 and it grows by 100% to $10,000 during the first year. During the second year, however, the investment suffers a 50% loss, from $10,000 back to $5,000.NARREND
-{2-Year Investment Narrative} Calculate the arithmetic mean.
(Essay)
4.8/5 (37)
NARRBEGIN: Credit Hours
Credit Hours
The College of Business at The State University of California produced 3,400 credit hours during Spring Semester, 2011he number and percentage of credit hours produced by each of the four departments in the College of Business is shown below. Department Percent Count Marketing 35.3 1.200 Management 23.5 800 Finance 23.5 800 Accounting 17.6 600 The following three-dimensional pie chart was constructed from the table above. 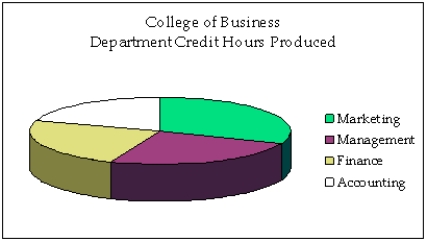 NARREND
-{Credit Hours Narrative} In what way does the original three-dimensional pie chart distort the data, compared to a two-dimensional pie chart?
NARREND
-{Credit Hours Narrative} In what way does the original three-dimensional pie chart distort the data, compared to a two-dimensional pie chart?
(Essay)
4.9/5 (34)
If the standard deviations of x and y are 12.5 and 10.8, respectively, and the covariance is 118.8, then the coefficient of correlation r is 0.88.
(True/False)
4.9/5 (40)
If the covariance of x and y is 26.16, and the standard deviation of x is 32.7, then the slope of the least squares line is b1 =.80.
(True/False)
4.9/5 (33)
The variance is a measure of the linear relationship between two variables
(True/False)
4.7/5 (41)
Which of the following statements about the median is not true?
(Multiple Choice)
4.9/5 (38)
NARRBEGIN: Ages of Senior Citizens
Ages of Senior Citizens
A sociologist recently conducted a survey of citizens over 65 years of age whose net worth is too high to qualify for Medicaid and who have no private health insurance. The ages of 22 uninsured senior citizens were as follows: 65, 66, 67, 68, 69, 70, 71, 73, 74, 75, 76, 77, 78, 79, 80, 81, 86, 87, 91, 92, 94, and 97.NARREND
-{Ages of Senior Citizens Narrative} Explain why there is no mode for this data set.
(Essay)
4.9/5 (35)
NARRBEGIN: Pets Survey
Pets Survey
A sample of 40 families were asked how many pets they owned. Their responses are summarized in the following table. Number of Pets 0 1 2 3 4 5 Number of Families 3 20 5 4 2 2 NARREND
-A basketball player has the following points for seven games: 20, 25, 32, 18, 19, 22, and 30. Compute the following measures of central location:
a.mean
b.median
c.mode
(Essay)
4.8/5 (30)
Filters
- Essay(0)
- Multiple Choice(0)
- Short Answer(0)
- True False(0)
- Matching(0)