Exam 2: Graphical Descriptive Techniques I
Exam 1: What Is Statistics43 Questions
Exam 2: Graphical Descriptive Techniques I93 Questions
Exam 3: Graphical Descriptive Techniques II140 Questions
Exam 4: Numerical Descriptive Techniques316 Questions
Exam 5: Data Collection and Sampling82 Questions
Exam 6: Probability237 Questions
Exam 7: Random Variables and Discrete Probability Distributions277 Questions
Exam 8: Continuous Probability Distributions215 Questions
Exam 9: Sampling Distributions154 Questions
Exam 10: Introduction to Estimation152 Questions
Exam 11: Introduction to Hypothesis Testing187 Questions
Exam 12: Inference About a Population149 Questions
Exam 13: Inference About Comparing Two Populations168 Questions
Exam 14: Analysis of Variance157 Questions
Exam 15: Chi-Squared Tests Optional175 Questions
Exam 16: Simple Linear Regression and Correlation301 Questions
Exam 17: Multiple Regression158 Questions
Select questions type
NARRBEGIN: Internet Classes
Internet Classes
A survey of 25 students was conducted to determine how they rate the quality of Internet classes. Students were asked to rate the overall quality from 0 (no quality at all) to 100 (extremely good quality). The stem-and-leaf display of the data is shown below. Stem Leaves 3 15 4 01457889 5 0134677 6 24568 7 29 8 9 5 NARREND
-A cross-classification table is used to describe the relationship between two ____________________ variables.
(Short Answer)
4.7/5  (34)
(34)
Which of the following situations is best suited for a pie chart?
(Multiple Choice)
4.9/5 (36)
The classification of student major (accounting, economics, management, marketing, other) is an example of a(n)
(Multiple Choice)
4.9/5 (29)
NARRBEGIN: Internet Classes
Internet Classes
A survey of 25 students was conducted to determine how they rate the quality of Internet classes. Students were asked to rate the overall quality from 0 (no quality at all) to 100 (extremely good quality). The stem-and-leaf display of the data is shown below. Stem Leaves 3 15 4 01457889 5 0134677 6 24568 7 29 8 9 5 NARREND
-The percentage of observations in each combination of the cross-classification table must be equal in order to show two nominal variables are not related.
(True/False)
4.8/5 (35)
NARRBEGIN: Internet Classes
Internet Classes
A survey of 25 students was conducted to determine how they rate the quality of Internet classes. Students were asked to rate the overall quality from 0 (no quality at all) to 100 (extremely good quality). The stem-and-leaf display of the data is shown below. Stem Leaves 3 15 4 01457889 5 0134677 6 24568 7 29 8 9 5 NARREND
-The bar charts below summarize data collected on 100 adults regarding gender and pet ownership. Which of the following statements is (are) true based on this chart? 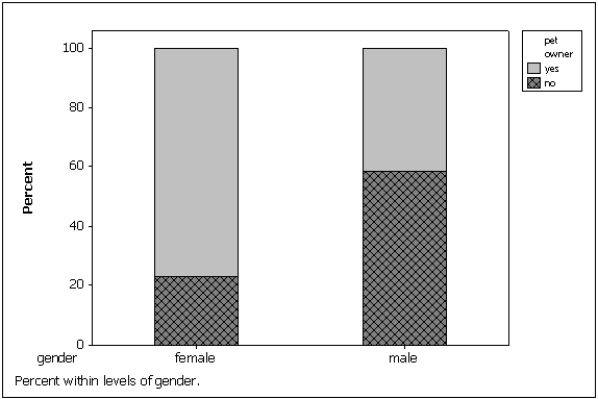
(Multiple Choice)
4.9/5 (30)
A relative frequency distribution lists the categories and their counts.
(True/False)
4.8/5 (27)
NARRBEGIN: Internet Classes
Internet Classes
A survey of 25 students was conducted to determine how they rate the quality of Internet classes. Students were asked to rate the overall quality from 0 (no quality at all) to 100 (extremely good quality). The stem-and-leaf display of the data is shown below. Stem Leaves 3 15 4 01457889 5 0134677 6 24568 7 29 8 9 5 NARREND
-Two hundred males and two hundred females were asked whether or not college baseball should have a playoff system (yes/no/undecided). Pie charts of the responses for males vs. females are shown below. Which of the following describes the relationship between gender and opinion? 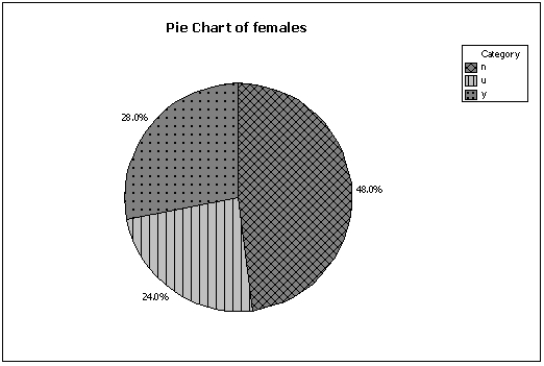
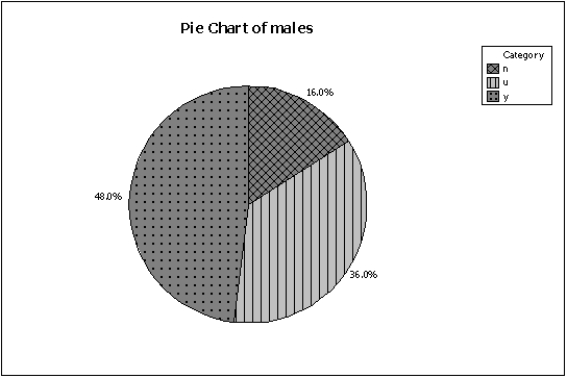
(Multiple Choice)
4.8/5 (25)
NARRBEGIN: Internet Classes
Internet Classes
A survey of 25 students was conducted to determine how they rate the quality of Internet classes. Students were asked to rate the overall quality from 0 (no quality at all) to 100 (extremely good quality). The stem-and-leaf display of the data is shown below. Stem Leaves 3 15 4 01457889 5 0134677 6 24568 7 29 8 9 5 NARREND
-In the following cross-classification table, gender and car ownership are related. Own a car Dan't Own a car Females 60 30 Males 40
(True/False)
4.8/5 (29)
Your final grade in a course (A, B, C, D, E) is a nominal variable.
(True/False)
4.7/5 (38)
Which of the following statements about pie charts is false?
(Multiple Choice)
4.7/5 (36)
NARRBEGIN: Internet Classes
Internet Classes
A survey of 25 students was conducted to determine how they rate the quality of Internet classes. Students were asked to rate the overall quality from 0 (no quality at all) to 100 (extremely good quality). The stem-and-leaf display of the data is shown below. Stem Leaves 3 15 4 01457889 5 0134677 6 24568 7 29 8 9 5 NARREND
-If two bar charts made from the rows of a cross-classification table look the same, then the two nominal variables ____________________ (are/are not) related.
(Short Answer)
4.8/5 (40)
With nominal data, there is one and only one way the possible values can be ordered.
(True/False)
4.9/5 (32)
Values must represent ordered rankings for what type of data?
(Multiple Choice)
4.9/5 (33)
NARRBEGIN: Internet Classes
Internet Classes
A survey of 25 students was conducted to determine how they rate the quality of Internet classes. Students were asked to rate the overall quality from 0 (no quality at all) to 100 (extremely good quality). The stem-and-leaf display of the data is shown below. Stem Leaves 3 15 4 01457889 5 0134677 6 24568 7 29 8 9 5 NARREND
-In the following cross-classification table, gender and fantasy baseball participation are related. Participate in Fantasy Fantball Dan't participate in Fantasy Faotball Males 75 25 Females 45 55
(True/False)
4.8/5 (40)
NARRBEGIN: All-Nighters
All-Nighters
A sample of 400 students at a certain university was taken after the midterm; 200 students reported staying up all night before the midterm and the other 200 students did not. Researchers recorded whether each student did well or poorly on the midterm. The following table contains the results. Did Well on Midterm Did Poorly on Midterm Stayed up all right 60 140 Did not stay up all night 120 80 NARREND
-{All-Nighters Narrative} Of those who did well on the midterm, what percentage stayed up all night before the midterm?
(Short Answer)
4.9/5 (44)
Filters
- Essay(0)
- Multiple Choice(0)
- Short Answer(0)
- True False(0)
- Matching(0)