Exam 2: Descriptive Statistics
Exam 1: Introduction49 Questions
Exam 2: Descriptive Statistics84 Questions
Exam 3: Data Visualization69 Questions
Exam 4: Descriptive Data Mining56 Questions
Exam 5: Probability: an Introduction to Modeling Uncertainty62 Questions
Exam 6: Statistical Inference62 Questions
Exam 7: Linear Regression71 Questions
Exam 8: Time Series Analysis and Forecasting58 Questions
Exam 9: Predictive Data Mining40 Questions
Exam 10: Spreadsheet Models64 Questions
Exam 11: Linear Optimization Models58 Questions
Exam 12: Integer Linear Optimization Models56 Questions
Exam 13: Nonlinear Optimization Models55 Questions
Exam 14: Monte Carlo Simulation59 Questions
Exam 15: Decision Analysis58 Questions
Select questions type
Scores on Ms. Bond's test have a mean of 70 and a standard deviation of 11. Michelle has a score of 48. Convert Michelle's score to a z-score. (Round to two decimal places if necessary.)
(Multiple Choice)
4.9/5  (33)
(33)
A quantity of interest that can take on different values is known as a(n)
(Multiple Choice)
4.7/5 (39)
When working with large spreadsheets with many rows of data, it can be helpful to ____________ the data to better find, view, or manage subsets of data.
(Multiple Choice)
4.9/5 (40)
The following table provides information on the number of billionaires in a country and the continents on which these countries are located. Nationality Contin ent Number of Billionaires United States North America 426 Brazil South America 38 Russia Europe 105 Mexico North America 37 India Asia 54 Turkey Europe 40 United Kingdom Europe 31 Hong Kong Asia 39 Germany Europe 57 Canada North America 28 China Asia 120
a. Sort the countries from largest to smallest based on the number of billionaires. What are the top five countries according to the number of billionaires?
b. Filter the countries to display only the countries located in North America.
(Essay)
4.9/5 (43)
What is the total relative frequency? ? 2015 Contest Sales Salesman Frequency Relative Frequency Frances Clonts 15 0.05 Sarah Leigh 184 0.62 Devon Pride 37 John Townes 62 0.21 Total 298 ?
(Multiple Choice)
4.8/5 (29)
The ________________ is a point estimate of the population mean for the variable of interest.
(Multiple Choice)
4.8/5 (43)
Compute the median of the following data. 32, 41, 36, 24, 29, 30, 40, 22, 25, 37
(Multiple Choice)
4.8/5 (43)
Eight observations taken for two variables are as follows: 11 35 13 32 17 26 18 25 22 20 24 17 26 11 28 10
a. Develop a scatter diagram with x on the horizontal axis.
b. What does the scatter diagram developed in part (a) indicate about the relationship between the two variables?
c. Compute and interpret the sample covariance.
d. Compute and interpret the sample correlation coefficient.
(Essay)
4.7/5 (36)
Compute the relative frequencies for the data given in the table below: Grades Number of students A 16 B 28 C 33 D 13 Total 90
(Multiple Choice)
4.8/5 (36)
Use technology to compute the standard deviation for the following sample data. 32, 41, 36, 24, 29, 30, 40, 22, 25, 37
(Multiple Choice)
4.7/5 (37)
Consider the data below. What percentage of students scored grade C? Grades Number of students A 16 B 28 C 33 D 13 Total 90
(Multiple Choice)
4.8/5 (42)
Below are the data for the number of days that it took Wyche Accounting to perform audits in the last quarter of last year.
56, 42, 37, 29, 45, 51, 30, 25, 34, 57
What is(are) the mode(s) number of days that it took Wyche Accounting to perform audits in the last quarter of last year?
(Short Answer)
4.8/5 (44)
Below is a histogram for the number of days that it took Wyche Accounting to perform audits in the last quarter of last year. What is the frequency of the 25-28 bin? 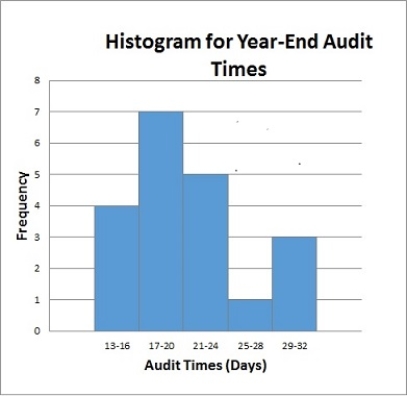
(Multiple Choice)
4.9/5 (41)
Compute the relative frequencies for students who earned an A shown in the table of grades below. ? Grades Number of Students A 10 B 31 C 36 D 6 ?
(Multiple Choice)
4.8/5 (34)
Scores on Ms. Nash's test have a mean of 64 and a standard deviation of 9. Steve has a score of 52. Convert Steve's score to a z-score. (Round to two decimal places if necessary.)
(Multiple Choice)
4.8/5 (36)
Compute the mode for the following data. 12, 16, 19, 10, 12, 11, 21, 12, 21, 10
(Multiple Choice)
4.9/5 (39)
The difference in a variable measured over observations (time, customers, items, etc.) is known as
(Multiple Choice)
4.9/5 (37)
Suppose that the average time an employee takes to reach the office is 35 minutes. To address the issue of late comers, the mode of transport chosen by the employee is tracked: private transport (two-wheelers and four-wheelers) and public transport. The data on the average time (in minutes) taken using both a private transportation system and a public transportation system for a sample of employees are given below. Private Transport Public Transport 27 30 33 29 28 25 32 20 20 27 34 32 30 37 28 38 18 21 29 35
a. Considering the travel times (in minutes) of employees using private transport, compute the z-score for the tenth employee with travel time of 29 minutes.
b. Considering the travel times (in minutes) of employees using public transport, compute the z-score for the second employee with travel time of 29 minutes. How does this z-score compare with the z-score you calculated for part a?
c. Based on z-scores, do the data for employees using private transport and public transport contain any outliers?
(Essay)
4.8/5 (40)
A _____________________ determines how far a particular value is from the mean relative to the data set's standard deviation.
(Multiple Choice)
4.8/5 (37)
Filters
- Essay(0)
- Multiple Choice(0)
- Short Answer(0)
- True False(0)
- Matching(0)