Exam 2: Descriptive Statistics
Exam 1: Introduction49 Questions
Exam 2: Descriptive Statistics84 Questions
Exam 3: Data Visualization69 Questions
Exam 4: Descriptive Data Mining56 Questions
Exam 5: Probability: an Introduction to Modeling Uncertainty62 Questions
Exam 6: Statistical Inference62 Questions
Exam 7: Linear Regression71 Questions
Exam 8: Time Series Analysis and Forecasting58 Questions
Exam 9: Predictive Data Mining40 Questions
Exam 10: Spreadsheet Models64 Questions
Exam 11: Linear Optimization Models58 Questions
Exam 12: Integer Linear Optimization Models56 Questions
Exam 13: Nonlinear Optimization Models55 Questions
Exam 14: Monte Carlo Simulation59 Questions
Exam 15: Decision Analysis58 Questions
Select questions type
A study on the average minutes spent by students on internet usage is 300 with a standard deviation of 102. Answer the following questions assuming a bell-shaped distribution and using the empirical rule.
a. What percentage of students use internet for more than 402 minutes?
b. What percentage of students use internet for more than 504 minutes?
c. What percentage of students use internet between 198 minutes and 300 minutes?
(Essay)
4.7/5  (44)
(44)
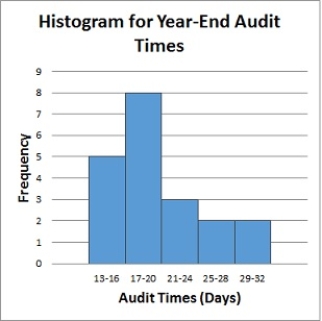
Below is a histogram for the number of days that it took Wyche Accounting to perform audits in the last quarter of last year. What is the relative frequency of the 21-24 bin? 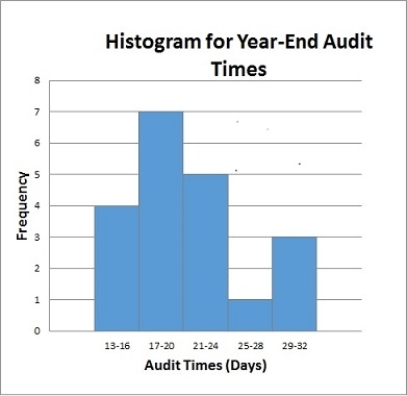
(Multiple Choice)
4.9/5 (38)
Below is a histogram for the number of days that it took Wyche Accounting to perform audits in the last quarter of last year. What is the relative frequency of the 21-24 bin?
(Short Answer)
4.8/5 (33)
A sample of 13 adult males' heights are listed below.
70, 72, 71, 70, 69, 73, 69, 68, 70, 71, 67, 71, 74
Find the range of the data.
(Multiple Choice)
4.8/5 (37)
The act of collecting data that are representative of the population data is called
(Multiple Choice)
4.9/5 (35)
Select the histogram that is moderately skewed right. 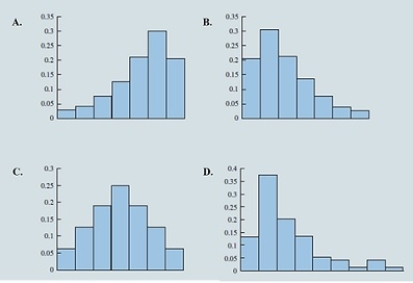
(Multiple Choice)
4.7/5 (32)
You would _________________ a table if you wanted to display only data that match specific criteria.
(Short Answer)
4.8/5 (32)
Consider the following data on income and savings of a sample of residents in a locality: Income (\ thousands) Savings (\ thousands) 50 10 51 11 52 13 55 14 56 15 58 15 60 16 62 16 65 17 66 17
a. Compute the correlation coefficient. Is there a positive correlation between the income and savings? What is your interpretation?
b. Show a scatter diagram of the relationship between the income and savings.
(Essay)
4.7/5 (34)
Compute the mean of the following data. 56, 42, 37, 29, 45, 51, 30, 25, 34, 57
(Multiple Choice)
5.0/5 (38)
____________________ are collected from several entities at the same point in time.
(Multiple Choice)
4.9/5 (36)
A survey on the most preferred newspaper in the USA listed The New York Times(TNYT), Washington Post(WP), Daily News(DN), New York Post(NYP), and Los Angeles Times (LAT) as the top five most preferred newspapers. The table below shows the preferences of 50 citizens. TNYT WP NYP WP TNYT DN TNYT LAT WP WP DN LAT TNYT TNYT NYP NYP TNYT WP LAT NYP LAT WP DN WP LAT WP DN TNYT DN DN TNYT THYT LAT TNYT NYP LAT LAT NY WP DN WP WP TNYT DN TNYT TNYT DN NYP TNYT WP
a. Are these data categorical or quantitative?
b. Provide frequency and percent frequency distributions.
c. On the basis of the sample, which newspaper is preferred the most?
(Essay)
4.9/5 (45)
The letter grades of business analysis students is recorded by a professor (4=A, 3=B, 2=C, 1=D). This variable's classification
(Multiple Choice)
4.8/5 (38)
Below is a histogram for the number of days that it took Wyche Accounting to perform audits in the last quarter of last year. What is the bin size for the histogram? 
(Multiple Choice)
4.8/5 (34)
In a survey of patients in a local hospital, 62.42% of the respondents indicated that the health care providers needed to spend more time with each patient. What is the sample for the population being studied?
(Multiple Choice)
4.9/5 (34)
In a survey of patients in a local hospital, 62.42% of the respondents indicated that the health care providers needed to spend more time with each patient. What is the population being studied?
(Multiple Choice)
4.8/5 (35)
A set of values corresponding to a set of variables is defined as a(n)
(Multiple Choice)
4.8/5 (40)
The average time a customer service executive takes to resolve an issue on a mobile handset is 26.4 minutes. The average times taken to resolve the issue by a sample of 15 such executives are shown below. Name Time (in minutes) Jack 25.3 Samantha 28.2 Richard 26.8 Steve 29.5 Mary 22.4 Sergio 21.7 John 24.3 Michelle 22.4 Linda 26.8 Mark 29.4 Matt 23.6 Polly 26.4 Sheila 23.5 Jeff 26.8 Gerald 28.1
a. What is the mean resolution time?
b. What is the median resolution time?
c. What is the mode for these 15 executives?
d. What is the variance and standard deviation?
e. What is the third quartile?
(Essay)
5.0/5 (32)
Identify the shape of the distribution in the figure below. 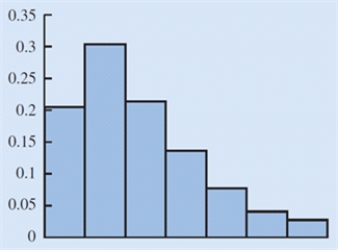
(Multiple Choice)
4.9/5 (42)
Suppose that the average time an employee takes to reach the office is 35 minutes. To address the issue of late comers, the mode of transport chosen by the employee is tracked: private transport (two-wheelers and four-wheelers) and public transport. The data on the average time (in minutes) taken using both a private transportation system and a public transportation system for a sample of employees are given below. Private Transport Public Transport 27 30 33 29 28 25 32 20 20 27 34 32 30 37 28 38 18 21 29 35
a. What are the mean and median travel times for employees using a private transport? What are the mean and median travel times for employees using a public transport?
b. What are the variance and standard deviation of travel times for employees using a private transport? What are the variance and standard deviation of travel times for employees using a public transport?
c. Comment on the results.
(Essay)
4.9/5 (38)
Filters
- Essay(0)
- Multiple Choice(0)
- Short Answer(0)
- True False(0)
- Matching(0)