Exam 14: Simple Linear Regression
Exam 1: Data and Statistics84 Questions
Exam 2: Descriptive Statistics: Tabular and Graphical Displays67 Questions
Exam 3: Descriptive Statistics: Numerical Measures127 Questions
Exam 4: Introduction to Probability99 Questions
Exam 5: Discrete Probability Distributions86 Questions
Exam 6: Continuous Probability Distributions120 Questions
Exam 7: Sampling and Sampling Distributions117 Questions
Exam 8: Interval Estimation144 Questions
Exam 9: Hypothesis Tests129 Questions
Exam 10: Inference About Means and Proportions With Two Populations85 Questions
Exam 11: Inferences About Population Variances85 Questions
Exam 12: Comparing Multiple Proportions, Tests of Independence and Goodness of Fit59 Questions
Exam 13: Experimental Design and Analysis of Variance80 Questions
Exam 14: Simple Linear Regression131 Questions
Exam 15: Multiple Regression103 Questions
Select questions type
If two variables, x and y, have a strong linear relationship, then
(Multiple Choice)
5.0/5  (31)
(31)
If two variables, x and y, have a strong linear relationship, then
(Multiple Choice)
4.8/5 (33)
It is not possible for the coefficient of determination to be
(Multiple Choice)
5.0/5 (44)
The following information regarding a dependent variable (y) and an independent variable (x) is provided. 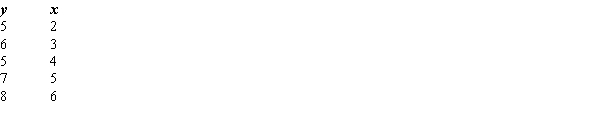 SSE = 1.9
SST = 6.8
The least squares estimate of the y-intercept is
SSE = 1.9
SST = 6.8
The least squares estimate of the y-intercept is
(Multiple Choice)
4.8/5 (32)
You are given the following information about y and x. 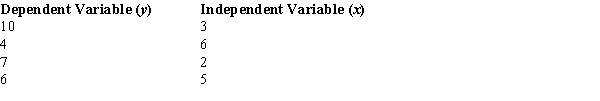 The coefficient of determination equals
(Multiple Choice)
4.8/5 (32)
If the coefficient of correlation is a negative value, then the
(Multiple Choice)
4.8/5 (34)
The model developed from sample data that has the form of  = b0 + b1x is known as the
(Multiple Choice)
4.9/5 (37)
Regression analysis is a statistical procedure for developing a mathematical equation that describes how
(Multiple Choice)
4.9/5 (32)
Regression analysis was applied between sales data (y in $1000s) and advertising data (x in $100s) and the following information was obtained.  = 12 + 1.8x
N = 17
SSR = 225
SSE = 75
Sb1 = .2683
Based on the above estimated regression equation, if advertising is $3000, then the point estimate for sales (in dollars) is
= 12 + 1.8x
N = 17
SSR = 225
SSE = 75
Sb1 = .2683
Based on the above estimated regression equation, if advertising is $3000, then the point estimate for sales (in dollars) is
(Multiple Choice)
4.7/5 (38)
Regression analysis was applied between sales data (y in $1000s) and advertising data (x in $100s) and the following information was obtained.  = 12 + 1.8x
N = 17
SSR = 225
SSE = 75
Sb1 = .2683
To perform an F test, the p-value is
= 12 + 1.8x
N = 17
SSR = 225
SSE = 75
Sb1 = .2683
To perform an F test, the p-value is
(Multiple Choice)
4.7/5 (28)
If the coefficient of correlation is .4, the percentage of variation in the dependent variable explained by the variation in the independent variable is
(Multiple Choice)
4.8/5 (38)
Regression analysis was applied and the least squares regression line was found to be  = 500 + 4x What would the residual be for an observed value of (3, 510)?
(Multiple Choice)
5.0/5 (34)
If the coefficient of determination is a positive value, then the coefficient of correlation
(Multiple Choice)
4.8/5 (34)
If the coefficient of correlation is .80, then the coefficient of determination
(Multiple Choice)
4.7/5 (33)
Filters
- Essay(0)
- Multiple Choice(0)
- Short Answer(0)
- True False(0)
- Matching(0)