Exam 13: Experimental Design and Analysis of Variance
Exam 1: Data and Statistics84 Questions
Exam 2: Descriptive Statistics: Tabular and Graphical Displays67 Questions
Exam 3: Descriptive Statistics: Numerical Measures127 Questions
Exam 4: Introduction to Probability99 Questions
Exam 5: Discrete Probability Distributions86 Questions
Exam 6: Continuous Probability Distributions120 Questions
Exam 7: Sampling and Sampling Distributions117 Questions
Exam 8: Interval Estimation144 Questions
Exam 9: Hypothesis Tests129 Questions
Exam 10: Inference About Means and Proportions With Two Populations85 Questions
Exam 11: Inferences About Population Variances85 Questions
Exam 12: Comparing Multiple Proportions, Tests of Independence and Goodness of Fit59 Questions
Exam 13: Experimental Design and Analysis of Variance80 Questions
Exam 14: Simple Linear Regression131 Questions
Exam 15: Multiple Regression103 Questions
Select questions type
In the analysis of variance procedure (ANOVA), "factor" refers to
(Multiple Choice)
4.9/5  (46)
(46)
Consider the following information. 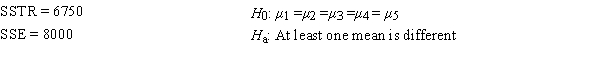
The mean square due to treatments (MSTR) equals
The mean square due to treatments (MSTR) equals
(Multiple Choice)
4.9/5 (37)
In an analysis of variance problem involving 3 treatments and 10 observations per treatment, SSE = 399.6.The MSE for this situation is
(Multiple Choice)
4.8/5 (35)
The critical F value with 8 numerator and 29 denominator degrees of freedom at α = .05 is
(Multiple Choice)
4.7/5 (35)
An ANOVA procedure is used for data obtained from five populations.Five samples, each comprised of 25 observations, were taken from the five populations.The numerator and denominator (respectively) degrees of freedom for the critical value of F are
(Multiple Choice)
5.0/5 (33)
Part of an ANOVA table is shown below. 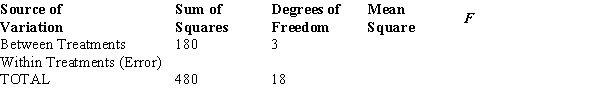 The mean square due to treatments (MSTR) is
(Multiple Choice)
4.8/5 (28)
An ANOVA procedure is used for data obtained from four populations.Four samples, each comprised of 25 observations, were taken from the four populations.The numerator and denominator (respectively) degrees of freedom for the critical value of F are
(Multiple Choice)
4.8/5 (30)
A completely randomized design is useful when the experimental units are
(Multiple Choice)
4.9/5 (32)
The required condition for using an ANOVA procedure on data from several populations is that the
(Multiple Choice)
4.8/5 (36)
Consider the following ANOVA table. 
The null hypothesis is to be tested at the 1% level of significance.The null hypothesis should
The null hypothesis is to be tested at the 1% level of significance.The null hypothesis should
(Multiple Choice)
5.0/5 (30)
To test whether or not there is a difference between treatments A, B, and C, a sample of 12 observations has been randomly assigned to the 3 treatments.You are given the results below. 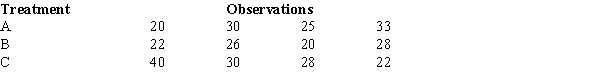
The null hypothesis is to be tested at the 1% level of significance.The null hypothesis
The null hypothesis is to be tested at the 1% level of significance.The null hypothesis
(Multiple Choice)
4.7/5 (31)
Part of an ANOVA table is shown below. 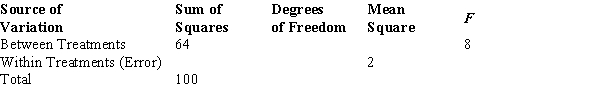 At a 5% level of significance, if we want to determine whether or not the means of the populations are equal, the conclusion of the test is that
(Multiple Choice)
4.9/5 (32)
Three major automobile manufacturers have entered their cars in the Indianapolis 500 race.The speeds (in miles per hour) of the tested cars are given below.Please note the sample sizes are not equal. 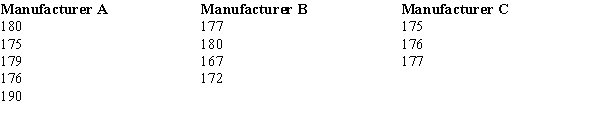
At α = .05, test to see if there is a significant difference in the average racing speeds of the cars of the three auto manufacturers.Use both the critical and p-value approaches.
At α = .05, test to see if there is a significant difference in the average racing speeds of the cars of the three auto manufacturers.Use both the critical and p-value approaches.
(Essay)
4.8/5 (29)
If we are testing for the equality of three population means, we should use the
(Multiple Choice)
4.8/5 (48)
Random samples were selected from three populations.The data obtained are shown below.Please note that the sample sizes are not equal. 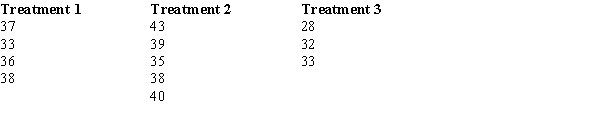
a.
Compute the overall mean
a.
Compute the overall mean  .
b.
At α = .01 using the critical value and p-value approaches, test to see if there is a significant difference among the treatment means.
.
b.
At α = .01 using the critical value and p-value approaches, test to see if there is a significant difference among the treatment means.
(Essay)
4.9/5 (37)
The test scores for selected samples of sociology students who took the course from three different instructors are shown below. 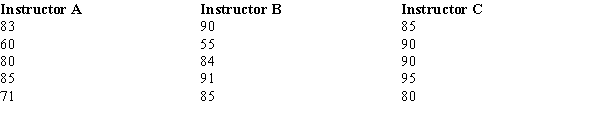
At α = .05, test to see if there is a significant difference among the averages of the three groups.Use both the critical value and p-value approaches.
At α = .05, test to see if there is a significant difference among the averages of the three groups.Use both the critical value and p-value approaches.
(Essay)
4.8/5 (42)
An ANOVA procedure is applied to data obtained from 6 samples where each sample contains 20 observations.The critical value of F occurs with
(Multiple Choice)
4.9/5 (32)
At α = .01, test to determine if the means of the three populations (from which the following samples are selected) are equal.Use both the critical and p-value approaches. 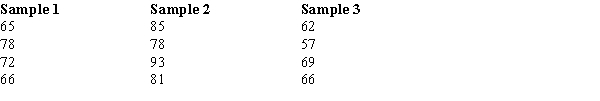
(Essay)
4.8/5 (29)
Consider the following ANOVA table. 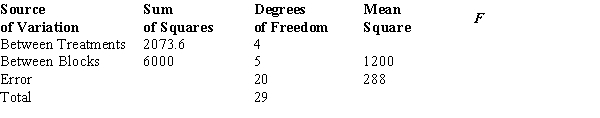
The null hypothesis is to be tested at the 1% level of significance.The p-value is
The null hypothesis is to be tested at the 1% level of significance.The p-value is
(Multiple Choice)
4.9/5 (37)
In a completely randomized experimental design involving five treatments, 13 observations were recorded for each of the five treatments (a total of 65 observations).The following information is provided.
SSTR = 300 (Sum of Squares Due to Treatments)
SST = 800 (Total Sum of Squares)
The test statistic is
(Multiple Choice)
4.8/5 (33)
Filters
- Essay(0)
- Multiple Choice(0)
- Short Answer(0)
- True False(0)
- Matching(0)