Exam 10: Inference About Means and Proportions With Two Populations
Exam 1: Data and Statistics84 Questions
Exam 2: Descriptive Statistics: Tabular and Graphical Displays67 Questions
Exam 3: Descriptive Statistics: Numerical Measures127 Questions
Exam 4: Introduction to Probability99 Questions
Exam 5: Discrete Probability Distributions86 Questions
Exam 6: Continuous Probability Distributions120 Questions
Exam 7: Sampling and Sampling Distributions117 Questions
Exam 8: Interval Estimation144 Questions
Exam 9: Hypothesis Tests129 Questions
Exam 10: Inference About Means and Proportions With Two Populations85 Questions
Exam 11: Inferences About Population Variances85 Questions
Exam 12: Comparing Multiple Proportions, Tests of Independence and Goodness of Fit59 Questions
Exam 13: Experimental Design and Analysis of Variance80 Questions
Exam 14: Simple Linear Regression131 Questions
Exam 15: Multiple Regression103 Questions
Select questions type
The results of a recent poll on the preference of shoppers regarding two products are shown below.  At 95% confidence, the margin of error is
(Multiple Choice)
4.7/5  (39)
(39)
The following are the results about the test scores of two samples of students from University A and University B on a national statistics examination.The population standard deviations are also shown below.Develop a 95% confidence interval estimate for the difference between the mean scores of the two populations. 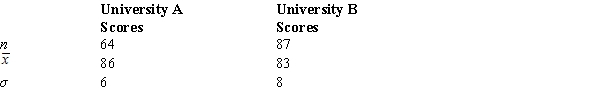
(Short Answer)
4.9/5 (33)
An insurance company selected samples of clients under 18 years of age and over 18 and recorded the number of accidents they had in the previous year.The results are shown below.  We are interested in determining if the accident proportions differ between the two age groups.The p-value is
(Multiple Choice)
4.9/5 (35)
A statistics teacher wants to see if there is any difference in the abilities of students enrolled in statistics today and those enrolled five years ago.A sample of final examination scores from students enrolled today and from students enrolled five years ago was taken.You are given the following information. 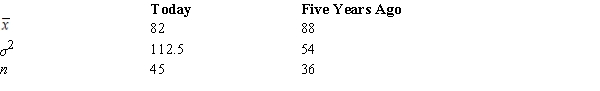 The 98% confidence interval for the difference between the two population means is
(Multiple Choice)
4.8/5 (39)
A statistics teacher wants to see if there is any difference in the abilities of students enrolled in statistics today and those enrolled five years ago.A sample of final examination scores from students enrolled today and from students enrolled five years ago was taken.You are given the following information.  The p-value for the difference between the two population means is
(Multiple Choice)
4.9/5 (33)
Using the following data regarding the ages (in years) of full-time and part-time students, develop an interval estimate for the difference between the mean ages of the two populations.Use 95% confidence.The degrees of freedom for the t distribution is 106.

(Short Answer)
4.8/5 (39)
A comparative study of organic and conventionally grown produce was checked for the presence of E.coli.Results are summarized below.Is there a significant difference in the proportion of E.coli in organic vs.conventionally grown produce? Test at α = .10. 
(Essay)
4.8/5 (29)
In a sample of 100 Republicans, 60 favored the President's anti-drug program.While in a sample of 150 Democrats, 84 favored his program.At α = .05, test to see if there is a significant difference in the proportions of the Democrats and the Republicans who favored the President's anti-drug program.
(Essay)
4.7/5 (30)
The results of a recent poll on the preference of shoppers regarding two products are shown below.  The 95% confidence interval estimate for the difference between the populations favoring the products is
(Multiple Choice)
4.8/5 (30)
Two independent simple random samples are taken to test the difference between the means of two populations whose variances are not known, but are assumed to be equal.The sample sizes are n1 = 31 and n2 = 40.The correct distribution to use is the t distribution with _____ degrees of freedom.
(Multiple Choice)
5.0/5 (31)
The following information was obtained from independent random samples taken of two populations. Assume normally distributed populations with equal variances. 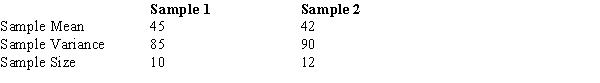
The 95% confidence interval for the difference between the two population means is (use rounded standard error)
The 95% confidence interval for the difference between the two population means is (use rounded standard error)
(Multiple Choice)
4.8/5 (27)
In a sample of 40 Democrats, 6 opposed the President's foreign policy; while of 50 Republicans, 8 were opposed to his policy.Determine a 90% confidence interval estimate for the difference between the proportions of the opinions of the individuals in the two parties.
(Short Answer)
4.7/5 (35)
Salary information regarding male and female employees of a large company is shown below. 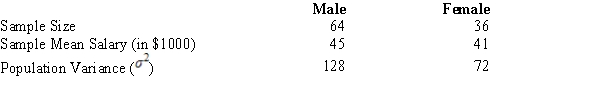 The point estimate of the difference between the means of the two populations is
(Multiple Choice)
4.8/5 (25)
The results of a recent poll on the preference of teenagers regarding the types of music they listen to are shown below.  The point estimate of the difference between the two population proportions is
(Multiple Choice)
4.9/5 (39)
In hypothesis tests about p1 - p2, the pooled estimator of p is a(n)
(Multiple Choice)
4.9/5 (41)
The following information was obtained from matched samples taken from two populations.Assume the population of differences is normally distributed.  The null hypothesis tested is H0: μd = 0.The test statistic for the difference between the two population means is
(Multiple Choice)
4.9/5 (41)
In order to estimate the difference between the average hourly wages of employees of two branches of a department store, the following data have been gathered. 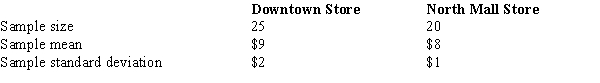 A point estimate for the difference between the two population means is
(Multiple Choice)
4.8/5 (33)
The results of a recent poll on the preference of shoppers regarding two products are shown below.  The point estimate for the difference between the two population proportions in favor of this product is
(Multiple Choice)
4.9/5 (37)
A statistics teacher wants to see if there is any difference in the abilities of students enrolled in statistics today and those enrolled five years ago.A sample of final examination scores from students enrolled today and from students enrolled five years ago was taken.You are given the following information. 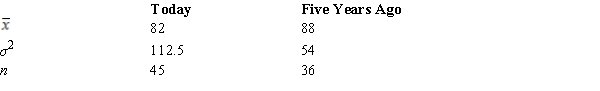 The test statistic for the difference between the two population means is
(Multiple Choice)
4.8/5 (40)
An insurance company selected samples of clients under 18 years of age and over 18 and recorded the number of accidents they had in the previous year.The results are shown below. 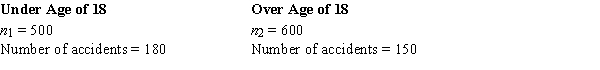 We are interested in determining if the accident proportions differ between the two age groups.
The pooled estimator of the population proportion is
We are interested in determining if the accident proportions differ between the two age groups.
The pooled estimator of the population proportion is
(Multiple Choice)
4.9/5 (35)
Filters
- Essay(0)
- Multiple Choice(0)
- Short Answer(0)
- True False(0)
- Matching(0)