Exam 10: Inference About Means and Proportions With Two Populations
Exam 1: Data and Statistics84 Questions
Exam 2: Descriptive Statistics: Tabular and Graphical Displays67 Questions
Exam 3: Descriptive Statistics: Numerical Measures127 Questions
Exam 4: Introduction to Probability99 Questions
Exam 5: Discrete Probability Distributions86 Questions
Exam 6: Continuous Probability Distributions120 Questions
Exam 7: Sampling and Sampling Distributions117 Questions
Exam 8: Interval Estimation144 Questions
Exam 9: Hypothesis Tests129 Questions
Exam 10: Inference About Means and Proportions With Two Populations85 Questions
Exam 11: Inferences About Population Variances85 Questions
Exam 12: Comparing Multiple Proportions, Tests of Independence and Goodness of Fit59 Questions
Exam 13: Experimental Design and Analysis of Variance80 Questions
Exam 14: Simple Linear Regression131 Questions
Exam 15: Multiple Regression103 Questions
Select questions type
Salary information regarding male and female employees of a large company is shown below. 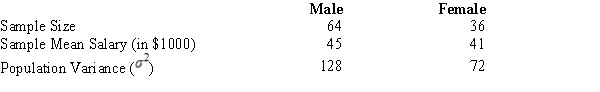 The 95% confidence interval for the difference between the means of the two populations is
(Multiple Choice)
4.7/5  (32)
(32)
Independent random samples taken at two companies provided the following information regarding annual salaries of the employees.The population standard deviations are also given below. 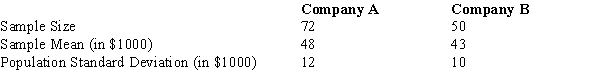
a.
We want to determine whether or not there is a significant difference between the average salaries of the employees at the two companies.Compute the test statistic.
b.
Compute the p-value; and at α = .05, test the hypotheses.
a.
We want to determine whether or not there is a significant difference between the average salaries of the employees at the two companies.Compute the test statistic.
b.
Compute the p-value; and at α = .05, test the hypotheses.
(Essay)
4.9/5 (34)
The management of a department store is interested in estimating the difference between the mean credit purchases of customers using the store's credit card versus those customers using a national major credit card.You are given the following information. 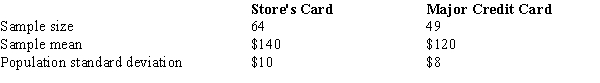 A point estimate for the difference between the mean purchases of all users of the two credit cards is
(Multiple Choice)
4.8/5 (39)
Two major automobile manufacturers have produced compact cars with engines of the same size.We are interested in determining whether or not there is a significant difference in the mean MPG (miles per gallon) when testing for the fuel efficiency of these two brands of automobiles.A random sample of eight cars from each manufacturer is selected, and eight drivers are selected to drive each automobile for a specified distance.The following data (in miles per gallon) show the results of the test.Assume the population of differences is normally distributed.  The test statistic is
(Multiple Choice)
4.9/5 (36)
The following information was obtained from matched samples taken from two populations. The daily production rates for a sample of workers before and after a training program are shown below.Assume the population of differences is normally distributed. 
The point estimate for the difference between the means of the two populations is
The point estimate for the difference between the means of the two populations is
(Multiple Choice)
4.9/5 (25)
A credit company has gathered information regarding the average amount (in $) owed by people under 30 years of age and by people over 30 years by taking independent random samples from both age groups.You are given the following information. 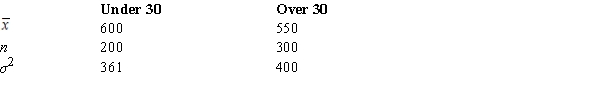
Construct a 95% confidence interval for the difference between the population average amounts owed by the two age groups.
Construct a 95% confidence interval for the difference between the population average amounts owed by the two age groups.
(Short Answer)
4.9/5 (37)
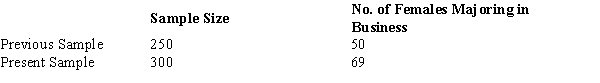
The office of records at a university has stated that the proportion of incoming female students who major in business has increased.A sample of female students taken several years ago is compared with a sample of female students this year.Results are summarized below.Has the proportion increased significantly? Test at α = .10.
(Essay)
4.9/5 (33)
To construct an interval estimate for the difference between the means of two populations when the standard deviations of the two populations are unknown and it can be assumed the two populations have equal variances, we must use a t distribution with (let n1 be the size of sample 1 and n2 the size of sample 2) _____ degrees of freedom.
(Multiple Choice)
5.0/5 (32)
The following information was obtained from matched samples taken from two populations. The daily production rates for a sample of workers before and after a training program are shown below.Assume the population of differences is normally distributed. 
The null hypothesis to be tested is H0: μd = 0.The test statistic is
The null hypothesis to be tested is H0: μd = 0.The test statistic is
(Multiple Choice)
5.0/5 (36)
The following information was obtained from matched samples taken from two populations. The daily production rates for a sample of workers before and after a training program are shown below.Assume the population of differences is normally distributed. 
Given that the null hypothesis to be tested is H0: μd = 0,
Given that the null hypothesis to be tested is H0: μd = 0,
(Multiple Choice)
4.9/5 (29)
If two independent large samples are taken from two populations, the sampling distribution of the difference between the two sample means
(Multiple Choice)
4.7/5 (40)
In order to estimate the difference between the average age of male and female employees at the Young Corporation, the following information was gathered.Develop a 95% confidence interval estimate. 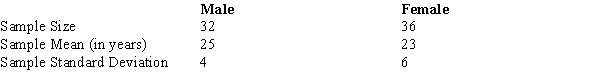
(Short Answer)
4.9/5 (28)
The following information was obtained from independent random samples taken of two populations. Assume normally distributed populations with equal variances. 
The standard error of
The standard error of  -
-  is
is
(Multiple Choice)
4.8/5 (38)
The following information was obtained from independent random samples taken of two populations. Assume normally distributed populations with equal variances. 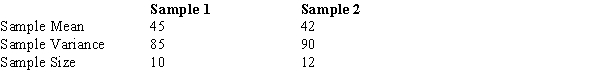
The point estimate for the difference between the means of the two populations is
The point estimate for the difference between the means of the two populations is
(Multiple Choice)
4.8/5 (35)
In order to determine whether or not there is a significant difference between the mean hourly wages paid by two companies (of the same industry), the following data have been accumulated. 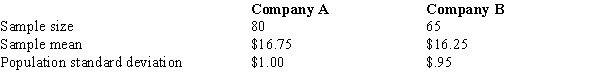 The test statistic is
(Multiple Choice)
4.8/5 (38)
The following information is gathered from random samples of day and evening students regarding the number of semester hours they take.
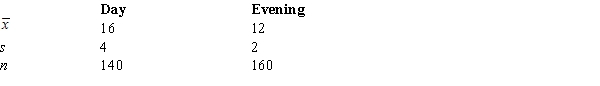
Develop a 95% confidence interval estimate for the difference between the mean semester hours taken by the two groups of students.
Develop a 95% confidence interval estimate for the difference between the mean semester hours taken by the two groups of students.
(Short Answer)
4.9/5 (31)
The following information was obtained from matched samples taken from two populations.Assume the population of differences is normally distributed.  The 98% confidence interval for the difference between the two population means is
(Multiple Choice)
5.0/5 (25)
Test scores on a standardized test from samples of students from two universities are given below. 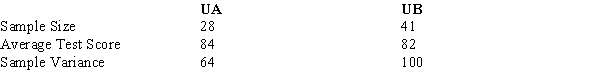
Provide a 98% confidence interval estimate for the difference between the mean test scores of the two universities.
Provide a 98% confidence interval estimate for the difference between the mean test scores of the two universities.
(Short Answer)
4.9/5 (35)
The results of a recent poll on the preference of teenagers regarding the types of music they listen to are shown below.  The 95% confidence interval for the difference between the two population proportions is
(Multiple Choice)
4.9/5 (33)
In a random sample of 200 Republicans, 160 opposed the new tax laws; while in a sample of 120 Democrats, 84 opposed.Determine a 95% confidence interval estimate for the difference between the proportions of Republicans and Democrats who opposed this new law.
(Short Answer)
5.0/5 (38)
Filters
- Essay(0)
- Multiple Choice(0)
- Short Answer(0)
- True False(0)
- Matching(0)