Exam 2: Descriptive Statistics: Tabular and Graphical Displays
Exam 1: Data and Statistics84 Questions
Exam 2: Descriptive Statistics: Tabular and Graphical Displays67 Questions
Exam 3: Descriptive Statistics: Numerical Measures127 Questions
Exam 4: Introduction to Probability99 Questions
Exam 5: Discrete Probability Distributions86 Questions
Exam 6: Continuous Probability Distributions120 Questions
Exam 7: Sampling and Sampling Distributions117 Questions
Exam 8: Interval Estimation144 Questions
Exam 9: Hypothesis Tests129 Questions
Exam 10: Inference About Means and Proportions With Two Populations85 Questions
Exam 11: Inferences About Population Variances85 Questions
Exam 12: Comparing Multiple Proportions, Tests of Independence and Goodness of Fit59 Questions
Exam 13: Experimental Design and Analysis of Variance80 Questions
Exam 14: Simple Linear Regression131 Questions
Exam 15: Multiple Regression103 Questions
Select questions type
A sample of fifteen 7-year old boys shows their favorite superheroes:  Which of the following is the correct relative frequency for Spiderman?
(Multiple Choice)
4.8/5  (32)
(32)
The sum of the percent frequencies for all classes will always equal
(Multiple Choice)
4.8/5 (27)
The numbers of hours worked (per week) by 400 statistics students are shown below. 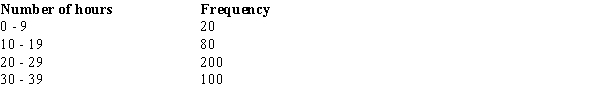 The cumulative percent frequency for < 29 hours is
(Multiple Choice)
4.8/5 (34)
Below you are given the examination scores of 20 students. 
a.
Construct a frequency distribution for this data.Let the first class be 50 - 59.
b.
Construct a cumulative frequency distribution.
c.
Construct a relative frequency distribution.
d.
Construct a cumulative relative frequency distribution.
a.
Construct a frequency distribution for this data.Let the first class be 50 - 59.
b.
Construct a cumulative frequency distribution.
c.
Construct a relative frequency distribution.
d.
Construct a cumulative relative frequency distribution.
(Essay)
4.9/5 (35)
A sample of fifteen 7-year old boys shows their favorite superheroes:  Which of the following is the correct frequency distribution?
(Multiple Choice)
4.9/5 (36)
Filters
- Essay(0)
- Multiple Choice(0)
- Short Answer(0)
- True False(0)
- Matching(0)