Exam 2: Descriptive Statistics: Tabular and Graphical Displays
Exam 1: Data and Statistics84 Questions
Exam 2: Descriptive Statistics: Tabular and Graphical Displays67 Questions
Exam 3: Descriptive Statistics: Numerical Measures127 Questions
Exam 4: Introduction to Probability99 Questions
Exam 5: Discrete Probability Distributions86 Questions
Exam 6: Continuous Probability Distributions120 Questions
Exam 7: Sampling and Sampling Distributions117 Questions
Exam 8: Interval Estimation144 Questions
Exam 9: Hypothesis Tests129 Questions
Exam 10: Inference About Means and Proportions With Two Populations85 Questions
Exam 11: Inferences About Population Variances85 Questions
Exam 12: Comparing Multiple Proportions, Tests of Independence and Goodness of Fit59 Questions
Exam 13: Experimental Design and Analysis of Variance80 Questions
Exam 14: Simple Linear Regression131 Questions
Exam 15: Multiple Regression103 Questions
Select questions type
The proper way to construct a stem-and-leaf display for the data set {62, 67, 68, 73, 73, 79, 91, 94, 95, 97} is to
(Multiple Choice)
4.8/5  (40)
(40)
A researcher is gathering data from four geographical areas designated: South = 1; North = 2; East = 3; West = 4.The designated geographical regions represent?
(Multiple Choice)
4.8/5 (35)
A sample of the class sizes of 10 statistics classes at a university is shown below. 
Construct a dot plot for the above data.
Construct a dot plot for the above data.
(Essay)
4.9/5 (38)
The numbers of hours worked (per week) by 400 statistics students are shown below.  The percentage of students who work at least 20 hours per week is
(Multiple Choice)
4.8/5 (38)
In a cumulative frequency distribution, the last class will always have a cumulative frequency equal to
(Multiple Choice)
4.8/5 (32)
The total number of data items with a value less than the upper limit for the class is given by the _____ distribution.
(Multiple Choice)
4.9/5 (41)
Which of the following is a graphical summary of a set of data in which each data value is represented by a dot above the axis?
(Multiple Choice)
4.9/5 (35)
If several frequency distributions are constructed from the same data set, the distribution with the widest class width will have the
(Multiple Choice)
4.8/5 (30)
A graphical tool typically associated with the display of key performance indicators is a
(Multiple Choice)
4.8/5 (44)
A graphical presentation of the relationship between two quantitative variables is
(Multiple Choice)
4.8/5 (27)
The numbers of hours worked (per week) by 400 statistics students are shown below. 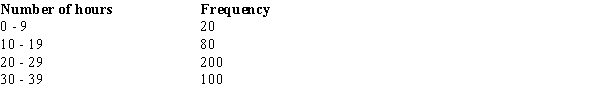 The cumulative percent frequency for students working 10 or more hours per week is
(Multiple Choice)
4.8/5 (50)
There are 800 students in the School of Business Administration.There are four majors in the School: Accounting, Finance, Management, and Marketing.The following shows the number of students in each major.  Develop a percent frequency distribution and construct a bar chart and a pie chart.
(Essay)
4.9/5 (34)
In a cumulative relative frequency distribution, the last class will have a cumulative relative frequency equal to
(Multiple Choice)
4.7/5 (42)
A sample of 15 children shows their favorite kind of pet: 
Which of the following displays is most appropriate for this data?
Which of the following displays is most appropriate for this data?
(Multiple Choice)
4.8/5 (36)
The frequency distribution below was constructed from data collected on the quarts of soft drinks consumed per week by 20 students. 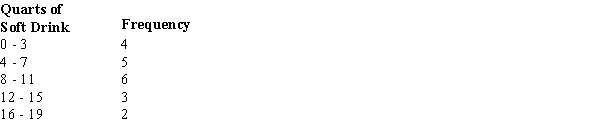
a.
Construct a relative frequency distribution.
b.
Construct a cumulative frequency distribution.
c.
Construct a cumulative relative frequency distribution.
a.
Construct a relative frequency distribution.
b.
Construct a cumulative frequency distribution.
c.
Construct a cumulative relative frequency distribution.
(Essay)
4.7/5 (32)
Which of the following types of data cannot be appropriately displayed by a histogram?
(Multiple Choice)
4.9/5 (27)
Filters
- Essay(0)
- Multiple Choice(0)
- Short Answer(0)
- True False(0)
- Matching(0)