Exam 18: Nonparametric Methods
Exam 1: Data and Statistics84 Questions
Exam 2: Descriptive Statistics: Tabular and Graphical Displays67 Questions
Exam 3: Descriptive Statistics: Numerical Measures118 Questions
Exam 4: Introduction to Probability94 Questions
Exam 5: Discrete Probability Distributions84 Questions
Exam 6: Continuous Probability Distributions121 Questions
Exam 7: Sampling and Sampling Distributions116 Questions
Exam 8: Interval Estimation90 Questions
Exam 9: Hypothesis Tests95 Questions
Exam 10: Inference About Means and Proportions With Two Populations63 Questions
Exam 11: Inferences About Population Variances66 Questions
Exam 12: Comparing Multiple Proportions, Tests of Independence and Goodness of Fit59 Questions
Exam 13: Experimental Design and Analysis of Variance76 Questions
Exam 14: Simple Linear Regression132 Questions
Exam 15: Multiple Regression103 Questions
Exam 16: Regression Analysis: Model Building41 Questions
Exam 17: Time Series Analysis and Forecasting51 Questions
Exam 18: Nonparametric Methods58 Questions
Exam 19: Decision Analysis48 Questions
Exam 20: Index Numbers39 Questions
Exam 21: Statistical Methods for Quality Control60 Questions
Exam 22: Sample Survey48 Questions
Select questions type
It has been hypothesized that there is no difference in the mathematical ability of men and women. To test this hypothesis, decision was taken to use the Mann-Whitney-Wilcoxon test. A sample of men and women were given math tests. The scores on the tests are given below. 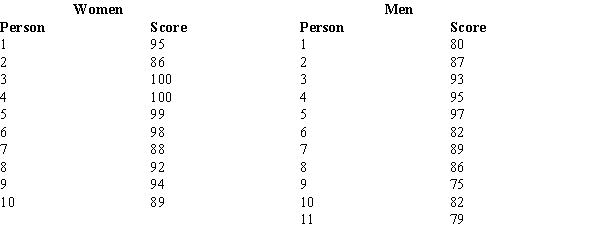 The standard deviation (σW) is
(Multiple Choice)
4.9/5  (32)
(32)
A comprehensive statistics examination is given to 16 students in order to determine whether or not there is a significant difference in the performance of students majoring in the various disciplines of Business Administration. The following data show the scores of the 17 students (6 majoring in accounting, 6 majoring in management, and 5 majoring in marketing). 
At α = .05, test to see if there is a significant difference in the performance of the students in the three majors.
At α = .05, test to see if there is a significant difference in the performance of the students in the three majors.
(Short Answer)
4.8/5 (30)
Students in statistics classes were asked whether they preferred a 10-minute break or to allow them go out of class 10 minutes early. In a sample of 150 students, 40 preferred a 10-minute break, 80 preferred going out 10 minutes early, and 30 had no preference. We want to determine if there is a difference in students' preferences. At the 1% level of significance, the null hypothesis should
(Multiple Choice)
4.9/5 (36)
Two faculty members (X and Y) ranked five candidates for scholarships based on performance in sports and after-school activities. The rankings are shown below. 
Compute the Spearman rank-correlation coefficient.
Compute the Spearman rank-correlation coefficient.
(Short Answer)
4.9/5 (28)
It is believed that the median yearly income in a suburb of Atlanta is $70,000. A sample of 67 residents was taken. Thirty-eight had yearly incomes above $70,000, 26 had yearly incomes below $70,000, and 3 had yearly incomes equal to $70,000. The null hypothesis to be tested is H0: Median = $70,000. The mean and the standard deviation (respectively) for this test about the median are
(Multiple Choice)
4.9/5 (29)
A clothing manufacturer purchased some newly designed sewing machines in the hopes that production would be increased. The production records (in units/week) of a random sample of workers are shown below. 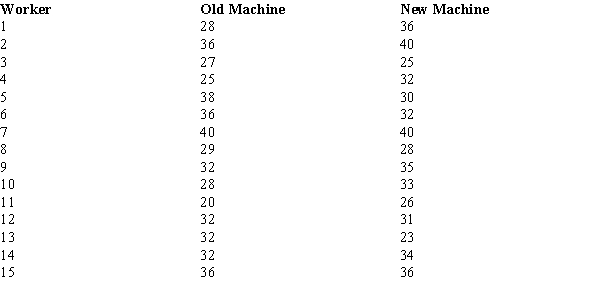
Use the Wilcoxon signed-rank test to determine whether the new machines have significantly increased production. Use a .10 level of significance.
Use the Wilcoxon signed-rank test to determine whether the new machines have significantly increased production. Use a .10 level of significance.
(Essay)
4.9/5 (40)
A nonparametric test for the equivalence of two populations would be used instead of a parametric test for the equivalence of the population parameters if
(Multiple Choice)
4.8/5 (34)
Fifteen people were asked to indicate their preference for domestic versus imported cars. The following data showed their preferences. 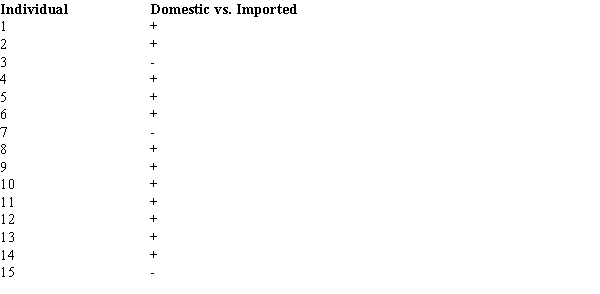
With α = .05, test for a significant difference in the preferences for cars. A "+" indicates a preference for imported cars.
With α = .05, test for a significant difference in the preferences for cars. A "+" indicates a preference for imported cars.
(Essay)
4.7/5 (38)
Nonparametric methods which can be used to make inferences about a population without requiring an assumption about the distribution of the population are also called
(Multiple Choice)
4.8/5 (33)
A company advertises that food preparation time can be significantly reduced with the Handy Dandy Slicer. A sample of 12 individuals prepared the ingredients for a meal with and without the slicer. You are given the preparation times (in minutes) below. 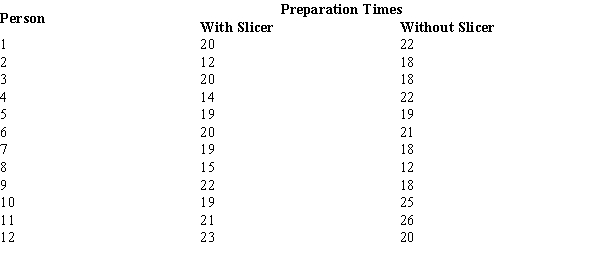 The p-value for this test is
(Multiple Choice)
4.7/5 (40)
Students in statistics classes were asked whether they preferred a 10-minute break or to allow them go out of class 10 minutes early. In a sample of 150 students, 40 preferred a 10-minute break, 80 preferred going out 10 minutes early, and 30 had no preference. We want to determine if there is a difference in students' preferences. The null hypothesis that is being tested is
(Multiple Choice)
4.8/5 (32)
Test scores of ten individuals before and after a training program are shown below. 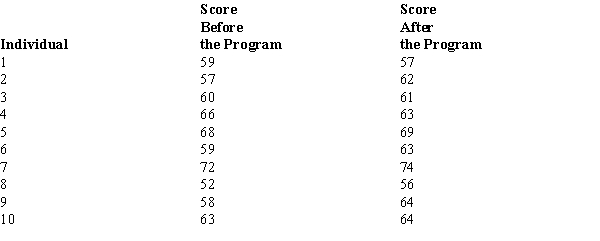
At α = .05, what can be concluded about the effectiveness of the training program?
At α = .05, what can be concluded about the effectiveness of the training program?
(Essay)
4.9/5 (29)
Students in statistics classes were asked whether they preferred a 10-minute break or to allow them go out of class 10 minutes early. In a sample of 150 students, 40 preferred a 10-minute break, 80 preferred going out 10 minutes early, and 30 had no preference. We want to determine if there is a difference in students' preferences. To test the null hypothesis, the appropriate probability distribution to use is
(Multiple Choice)
4.7/5 (36)
The level of measurement that is simply a label for the purpose of identifying an item which can be used in nonparametric procedures is _____ measurement.
(Multiple Choice)
4.8/5 (37)
In a sample of 120 people, 50 indicated that they prefer domestic automobiles, 60 said they prefer foreign-made cars, and 10 indicated no difference in their preference. At a .05 level of significance, determine if there is evidence of a significant difference in the preferences for the two makes of automobiles. Hint: Use the continuity correction factor.
(Essay)
5.0/5 (36)
It is believed that the median yearly income in a suburb of Atlanta is $70,000. A sample of 67 residents was taken. Thirty-eight had yearly incomes above $70,000, 26 had yearly incomes below $70,000, and 3 had yearly incomes equal to $70,000. The null hypothesis to be tested is H0: Median = $70,000. To test the null hypothesis, the appropriate probability distribution to use is
(Multiple Choice)
4.8/5 (35)
Filters
- Essay(0)
- Multiple Choice(0)
- Short Answer(0)
- True False(0)
- Matching(0)