Exam 12: Comparing Multiple Proportions, Tests of Independence and Goodness of Fit
Exam 1: Data and Statistics84 Questions
Exam 2: Descriptive Statistics: Tabular and Graphical Displays67 Questions
Exam 3: Descriptive Statistics: Numerical Measures118 Questions
Exam 4: Introduction to Probability94 Questions
Exam 5: Discrete Probability Distributions84 Questions
Exam 6: Continuous Probability Distributions121 Questions
Exam 7: Sampling and Sampling Distributions116 Questions
Exam 8: Interval Estimation90 Questions
Exam 9: Hypothesis Tests95 Questions
Exam 10: Inference About Means and Proportions With Two Populations63 Questions
Exam 11: Inferences About Population Variances66 Questions
Exam 12: Comparing Multiple Proportions, Tests of Independence and Goodness of Fit59 Questions
Exam 13: Experimental Design and Analysis of Variance76 Questions
Exam 14: Simple Linear Regression132 Questions
Exam 15: Multiple Regression103 Questions
Exam 16: Regression Analysis: Model Building41 Questions
Exam 17: Time Series Analysis and Forecasting51 Questions
Exam 18: Nonparametric Methods58 Questions
Exam 19: Decision Analysis48 Questions
Exam 20: Index Numbers39 Questions
Exam 21: Statistical Methods for Quality Control60 Questions
Exam 22: Sample Survey48 Questions
Select questions type
In the past, 35% of the students at ABC University were in the Business College, 35% of the students were in the Liberal Arts College, and 30% of the students were in the Education College. To see whether or not the proportions have changed, a sample of 300 students from the university was taken. Ninety of the sample students are in the Business College, 120 are in the Liberal Arts College, and 90 are in the Education College. The calculated value for the test statistic equals
Free
(Multiple Choice)
4.8/5  (28)
(28)
Correct Answer: Verified
C
A group of 2000 individuals from 3 different cities were asked whether they owned a foreign or a domestic car. The following table shows the results of the survey. 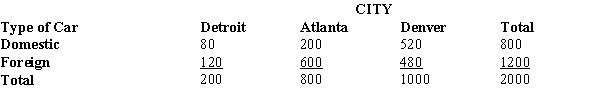
At α = .01 using the p-value approach, test to determine if the type of car purchased is independent of the city in which the purchasers live.
At α = .01 using the p-value approach, test to determine if the type of car purchased is independent of the city in which the purchasers live.
Free
(Essay)
4.7/5 (34)
Correct Answer:Verified
χ2 = 135; p-value is almost zero; thus, reject H0 and conclude that the type of car purchased is not independent of the city. Critical value is 9.210.
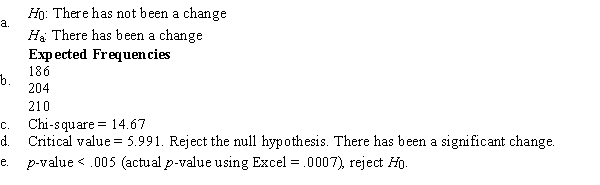
During the first few weeks of the new television season, the evening news audience proportions were recorded as ABC - 31%, CBS - 34%, and NBC - 35%. A sample of 600 homes taken recently yielded the following viewing audience data. 
We want to determine whether or not there has been a significant change in the proportion of viewing audience of the three networks.
a.
State the null and alternative hypotheses to be tested.
b.
Compute the expected frequencies.
c.
Compute the test statistic.
d.
The null hypothesis is to be tested at the .05 level of significance. Determine the critical value for this test. What do you conclude?
e.
Determine the p-value and perform the test.
Free
(Essay)
4.9/5 (29)
Correct Answer:Verified
Last school year, the student body of a local university consisted of 30% freshmen, 24% sophomores, 26% juniors, and 20% seniors. A sample of 400 students taken from this year's student body showed the following number of students in each classification.  We are interested in determining whether or not there has been a significant change in the classifications between the last school year and this school year. The expected frequency of seniors is
(Multiple Choice)
4.8/5 (36)
You want to test whether or not the following sample of 30 observations follows a normal distribution. The mean of the sample equals 11.83 and the standard deviation equals 4.53. 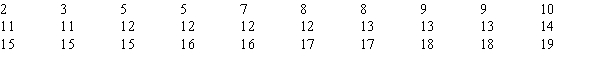 At the 5% level of significance, the conclusion of the test is that the
(Multiple Choice)
4.8/5 (37)
The number of emergency calls per day at a hospital over a period of 120 days is shown below. 
Use α = .05 and the p-value approach to see if the above data have a Poisson distribution.
Use α = .05 and the p-value approach to see if the above data have a Poisson distribution.
(Essay)
4.9/5 (32)
The degrees of freedom for a table with 7 rows and 4 columns is
(Multiple Choice)
4.7/5 (38)
In the past, 35% of the students at ABC University were in the Business College, 35% of the students were in the Liberal Arts College, and 30% of the students were in the Education College. To see whether or not the proportions have changed, a sample of 300 students from the university was taken. Ninety of the sample students are in the Business College, 120 are in the Liberal Arts College, and 90 are in the Education College. This problem is an example of a
(Multiple Choice)
4.8/5 (37)
A group of 500 individuals were asked to cast their votes regarding a particular issue of the Equal Rights Amendment. The following table shows the results of the votes: 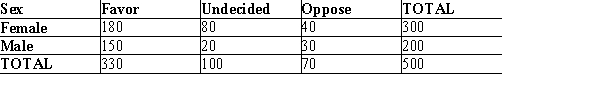
At α = .05 using the p-value approach, test to determine if the votes cast were independent of the sex of the individuals.
At α = .05 using the p-value approach, test to determine if the votes cast were independent of the sex of the individuals.
(Essay)
4.9/5 (39)
The table below gives beverage preferences for random samples of teens and adults.  We are asked to test for independence between age (i.e., adult and teen) and drink preferences. The test statistic for this test of independence is
(Multiple Choice)
4.9/5 (31)
The owner of a car wash wants to see if the arrival rate of cars follows a Poisson distribution. In order to test the assumption of a Poisson distribution, a random sample of 150 ten-minute intervals was taken. You are given the following observed frequencies:  At the .05 level of significance, the conclusion of the test is that the
(Multiple Choice)
4.9/5 (39)
A statistical test conducted to determine whether to reject or not reject a hypothesized probability distribution for a population is known as a _____ test.
(Multiple Choice)
4.8/5 (29)
The number of categorical outcomes per trial for a multinomial probability distribution is
(Multiple Choice)
4.7/5 (20)
Marascuilo procedure is used to test for a significant difference between pairs of population
(Multiple Choice)
4.8/5 (32)
Before the rush began for Christmas shopping, a department store had noted that the percentage of its customers who use the store's credit card, the percentage of those who use a major credit card, and the percentage of those who pay cash are the same. During the Christmas rush, in a sample of 210 shoppers, 66 used the store's credit card; 63 used a major credit card; and 81 paid cash. With α = .05, test to see if the methods of payment have changed during the Christmas rush.
(Essay)
4.8/5 (38)
In the past, 35% of the students at ABC University were in the Business College, 35% of the students were in the Liberal Arts College, and 30% of the students were in the Education College. To see whether or not the proportions have changed, a sample of 300 students from the university was taken. Ninety of the sample students are in the Business College, 120 are in the Liberal Arts College, and 90 are in the Education College. The expected frequency for the Business College is
(Multiple Choice)
4.8/5 (40)
A population where each of its element is assigned to one and only one of several classes or categories is a _____ population.
(Multiple Choice)
4.9/5 (34)
When individuals in a sample of 150 were asked whether or not they supported capital punishment, the following information was obtained.  We are interested in determining whether or not the opinions of the individuals (as to Yes, No, and No Opinion) are uniformly distributed. The conclusion of the test at the 5% level of significance is that the
(Multiple Choice)
4.8/5 (31)
The owner of a car wash wants to see if the arrival rate of cars follows a Poisson distribution. In order to test the assumption of a Poisson distribution, a random sample of 150 ten-minute intervals was taken. You are given the following observed frequencies: 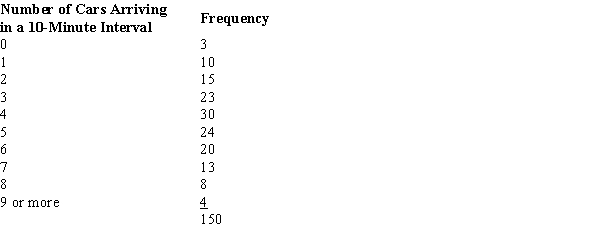 Calculate mean and use Poisson probabilities. The expected frequency of exactly 3 cars arriving in a 10-minute interval is
(Multiple Choice)
4.9/5 (38)
Filters
- Essay(0)
- Multiple Choice(0)
- Short Answer(0)
- True False(0)
- Matching(0)