Exam 2: Descriptive Statistics: Tabular and Graphical Displays
Exam 1: Data and Statistics84 Questions
Exam 2: Descriptive Statistics: Tabular and Graphical Displays67 Questions
Exam 3: Descriptive Statistics: Numerical Measures118 Questions
Exam 4: Introduction to Probability94 Questions
Exam 5: Discrete Probability Distributions84 Questions
Exam 6: Continuous Probability Distributions121 Questions
Exam 7: Sampling and Sampling Distributions116 Questions
Exam 8: Interval Estimation90 Questions
Exam 9: Hypothesis Tests95 Questions
Exam 10: Inference About Means and Proportions With Two Populations63 Questions
Exam 11: Inferences About Population Variances66 Questions
Exam 12: Comparing Multiple Proportions, Tests of Independence and Goodness of Fit59 Questions
Exam 13: Experimental Design and Analysis of Variance76 Questions
Exam 14: Simple Linear Regression132 Questions
Exam 15: Multiple Regression103 Questions
Exam 16: Regression Analysis: Model Building41 Questions
Exam 17: Time Series Analysis and Forecasting51 Questions
Exam 18: Nonparametric Methods58 Questions
Exam 19: Decision Analysis48 Questions
Exam 20: Index Numbers39 Questions
Exam 21: Statistical Methods for Quality Control60 Questions
Exam 22: Sample Survey48 Questions
Select questions type
The numbers of hours worked (per week) by 400 statistics students are shown below. 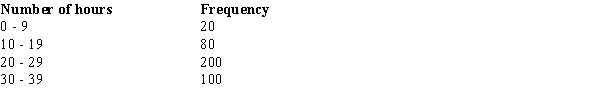 The cumulative percent frequency for students working 10 or more hours per week is
Free
(Multiple Choice)
4.9/5  (37)
(37)
Correct Answer: Verified
D
A cumulative relative frequency distribution shows
Free
(Multiple Choice)
4.8/5 (29)
Correct Answer:Verified
A
A sample of fifteen 7-year old boys shows their favorite superheroes:  Which of the following is the correct relative frequency for Spiderman?
Free
(Multiple Choice)
4.7/5 (40)
Correct Answer:Verified
C
The grades of 10 students in their first management test are shown below. 
a.
Construct a frequency distribution. Let the first class be 60 - 69.
b.
Construct a cumulative frequency distribution.
c.
Construct a relative frequency distribution.
a.
Construct a frequency distribution. Let the first class be 60 - 69.
b.
Construct a cumulative frequency distribution.
c.
Construct a relative frequency distribution.
(Essay)
4.8/5 (36)
Which of the following is least useful in making comparisons or showing the relationships of two variables?
(Multiple Choice)
4.9/5 (36)
Below you are given the examination scores of 20 students. 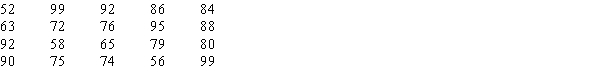
a.
Construct a frequency distribution for this data. Let the first class be 50 - 59.
b.
Construct a cumulative frequency distribution.
c.
Construct a relative frequency distribution.
d.
Construct a cumulative relative frequency distribution.
a.
Construct a frequency distribution for this data. Let the first class be 50 - 59.
b.
Construct a cumulative frequency distribution.
c.
Construct a relative frequency distribution.
d.
Construct a cumulative relative frequency distribution.
(Essay)
4.9/5 (35)
A tabular summary of a set of data showing the fraction of the total number of items in several classes is a _____ distribution.
(Multiple Choice)
4.8/5 (36)
In quality control applications, bar charts are used to identify the most important causes of problems. When the bars are arranged in descending order of height from left to right with the most frequently occurring cause appearing first, the bar chart is called a
(Multiple Choice)
4.9/5 (48)
The frequency distribution below was constructed from data collected on the quarts of soft drinks consumed per week by 20 students. 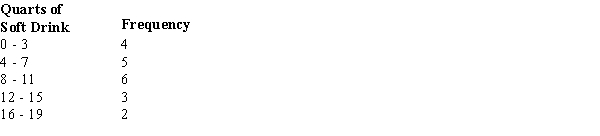
a.
Construct a relative frequency distribution.
b.
Construct a cumulative frequency distribution.
c.
Construct a cumulative relative frequency distribution.
a.
Construct a relative frequency distribution.
b.
Construct a cumulative frequency distribution.
c.
Construct a cumulative relative frequency distribution.
(Essay)
4.8/5 (45)
A display used to compare the frequency, relative frequency or percent frequency of two categorical variables is a
(Multiple Choice)
4.8/5 (34)
A sample of fifteen 7-year old boys shows their favorite superheroes:  Which of the following is the correct percent frequency for Spiderman?
(Multiple Choice)
4.8/5 (35)
The sum of the percent frequencies for all classes will always equal
(Multiple Choice)
4.8/5 (34)
A survey of 800 college seniors resulted in the following crosstabulation regarding their undergraduate major and whether or not they plan to go to graduate school. 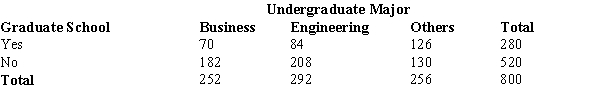 The above crosstabulation shows
(Multiple Choice)
4.9/5 (33)
The frequency distribution below was constructed from data collected from a group of 25 students. 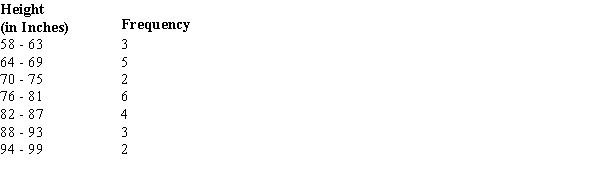
a.
Construct a relative frequency distribution.
b.
Construct a cumulative frequency distribution.
c.
Construct a cumulative relative frequency distribution.
a.
Construct a relative frequency distribution.
b.
Construct a cumulative frequency distribution.
c.
Construct a cumulative relative frequency distribution.
(Essay)
4.8/5 (37)
The total number of data items with a value less than the upper limit for the class is given by the _____ distribution.
(Multiple Choice)
4.9/5 (40)
When the conclusions based upon the unaggregated data can be completely reversed if we look at the aggregated crosstabulation, the occurrence is known as
(Multiple Choice)
4.8/5 (39)
Filters
- Essay(0)
- Multiple Choice(0)
- Short Answer(0)
- True False(0)
- Matching(0)