Exam 3: Descriptive Statistics: Numerical Measures
Exam 1: Data and Statistics84 Questions
Exam 2: Descriptive Statistics: Tabular and Graphical Displays67 Questions
Exam 3: Descriptive Statistics: Numerical Measures118 Questions
Exam 4: Introduction to Probability94 Questions
Exam 5: Discrete Probability Distributions84 Questions
Exam 6: Continuous Probability Distributions121 Questions
Exam 7: Sampling and Sampling Distributions116 Questions
Exam 8: Interval Estimation90 Questions
Exam 9: Hypothesis Tests95 Questions
Exam 10: Inference About Means and Proportions With Two Populations63 Questions
Exam 11: Inferences About Population Variances66 Questions
Exam 12: Comparing Multiple Proportions, Tests of Independence and Goodness of Fit59 Questions
Exam 13: Experimental Design and Analysis of Variance76 Questions
Exam 14: Simple Linear Regression132 Questions
Exam 15: Multiple Regression103 Questions
Exam 16: Regression Analysis: Model Building41 Questions
Exam 17: Time Series Analysis and Forecasting51 Questions
Exam 18: Nonparametric Methods58 Questions
Exam 19: Decision Analysis48 Questions
Exam 20: Index Numbers39 Questions
Exam 21: Statistical Methods for Quality Control60 Questions
Exam 22: Sample Survey48 Questions
Select questions type
The following is the frequency distribution for the speed of a sample of automobiles traveling on an interstate highway. 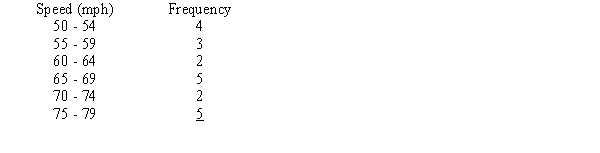 The mean is
(Multiple Choice)
4.8/5  (39)
(39)
The value which has half of the observations above it and half the observations below it is called the
(Multiple Choice)
4.8/5 (29)
A group of students had dinner at a local restaurant. The total bill for the dinner was $364.99. Each student paid his/her equal share of the bill, which was $21.47. How many student's were at the dinner?
(Multiple Choice)
4.8/5 (33)
If the coefficient of variation is 40% and the mean is 70, then the variance is
(Multiple Choice)
4.8/5 (32)
Which of the following symbols represents the size of the sample?
(Multiple Choice)
4.8/5 (44)
An unusually small or unusually large data value is called
(Multiple Choice)
4.8/5 (46)
Which of the following is not a measure of variability of a single variable?
(Multiple Choice)
4.9/5 (41)
During a cold winter, the temperature stayed below zero for ten days (ranging from -20 to -5). The variance of the temperatures of the ten-day period
(Multiple Choice)
4.9/5 (35)
The measure of variability easiest to compute, but seldom used as the only measure, is the
(Multiple Choice)
4.8/5 (29)
Functionality in interactive data dashboards that allows the user to access information and analyze at an increasingly detailed level is referred to as
(Multiple Choice)
4.9/5 (33)
When the data are skewed to the right, the measure of Skewness will be
(Multiple Choice)
4.7/5 (30)
Given the following information: Standard deviation = 8
Coefficient of variation = 64%
The mean would then be
(Multiple Choice)
4.8/5 (39)
Filters
- Essay(0)
- Multiple Choice(0)
- Short Answer(0)
- True False(0)
- Matching(0)