Exam 22: Statistical Inference: Conclusion
Exam 1: What Is Statistics16 Questions
Exam 2: Types of Data, Data Collection and Sampling17 Questions
Exam 3: Graphical Descriptive Methods Nominal Data20 Questions
Exam 4: Graphical Descriptive Techniques Numerical Data64 Questions
Exam 5: Numerical Descriptive Measures150 Questions
Exam 6: Probability112 Questions
Exam 7: Random Variables and Discrete Probability Distributions55 Questions
Exam 8: Continuous Probability Distributions118 Questions
Exam 9: Statistical Inference: Introduction8 Questions
Exam 10: Sampling Distributions68 Questions
Exam 11: Estimation: Describing a Single Population132 Questions
Exam 12: Estimation: Comparing Two Populations23 Questions
Exam 13: Hypothesis Testing: Describing a Single Population130 Questions
Exam 14: Hypothesis Testing: Comparing Two Populations81 Questions
Exam 15: Inference About Population Variances47 Questions
Exam 16: Analysis of Variance125 Questions
Exam 17: Additional Tests for Nominal Data: Chi-Squared Tests116 Questions
Exam 18: Simple Linear Regression and Correlation219 Questions
Exam 19: Multiple Regression121 Questions
Exam 20: Model Building100 Questions
Exam 21: Nonparametric Techniques136 Questions
Exam 22: Statistical Inference: Conclusion106 Questions
Exam 23: Time-Series Analysis and Forecasting146 Questions
Exam 24: Index Numbers27 Questions
Exam 25: Decision Analysis51 Questions
Select questions type
Based on sample data, the 95% confidence interval limits for the population mean are LCL = 124.6 and UCL = 148.2. If the 5% level of significance were used in testing the hypotheses:
H0 : = 150
H1 : 150,
The null hypothesis: A would not be rejected. B would be rejected. C would have to be revised. D There is insufficient information to decide whether to maintain or reject the null hypothesis.
(Short Answer)
4.9/5  (38)
(38)
If a sample has 20 observations and a 95% confidence estimate for is needed, the appropriate t-score is 1.729.
(True/False)
4.9/5 (34)
A statistics course at a large university is taught in each semester. A student has noticed that the students in semester 1 and semester 2 are enrolled in different degrees. To investigate, the student takes a random sample of 25 students from semester 1 and 25 students from semester 2 and records their final marks (%) provided in the table below. Excel was used to generate descriptive statistics on each sample.
Assume that student final marks are normally distributed in each semester. Sample of semester 1 final marks 65 45 53 76 53 85 55 63 85 77 45 57 55 60 83 96 83 55 52 67 82 64 62 88 71 Sample of semester 2 final marks 45 40 53 58 75 46 82 54 75 59 45 54 87 77 63 81 60 56 53 65 52 65 60 65 54 Semester 1 Mean 65.48 Stan dard Error 2.679 Median 63 Mode 55 Standard Deviation 13.395 Sample Variance 179.43 Range 43 Minimum 45 Maximum 88 Sum 1637 Count 25 Semester 2 Mean 60.96 Standard Error 2.5136 Median 59 Mode 54 Standard Deviation 12.568 Sample Variance 157.96 Range 47 Minimum 40 Maximum 87 Sum 1524 Count 25 (a) Determine whether these data are sufficient to infer at the 10% level of significance that the two population variances differ.
(b) Explain the decision of your test in part (a) in the context of this question.
(Essay)
4.9/5 (41)
Assuming that all necessary conditions are met, what needs to be changed in the formula 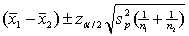 so that we can use it to construct a confidence interval estimate for the difference of two population means when the population variances are assumed to be equal?
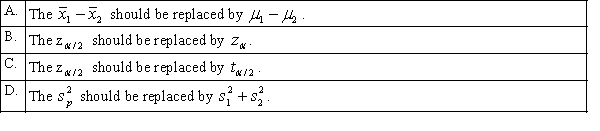
(Short Answer)
4.9/5 (36)
Videocassette recorder (VCR) tapes are designed so that users can repeatedly record new material over old material. However, after a number of re-recordings the tape begins to deteriorate. A VCR tape manufacturer is experimenting with a new technology, which hopefully will produce longer-lasting tapes. Thirty of the old-style tapes and 30 utilising the new technology were used in an experiment. The tapes were used to record and re-record programs until they began to deteriorate. The number of re-recordings is assumed to be normally distributed. It is generally accepted that the number of re-recordings should exceed 55. Any tapes that do not meet this criterion are considered to be unacceptable. The number of re-recordings were observed and shown in the accompanying table.
60 61 48 68 70 58 51 46 66 74 72 69 66 63 61 77 73 49 73 55 71 59 66 61 71 49 76 52 58 59 47 56 55 66 51 49 60 62 64 62 59 57 52 51 63 51 56 66 64 68 52 50 55 76 47 55 58 63 68 78 Can we conclude at the 10% significance level that the new tapes last longer than the old tapes?
(Essay)
4.8/5 (33)
When the necessary conditions are met, a one-tail test is being conducted to test the difference between two population proportions, but your statistical software provides only a two-tail area of 0.058 as part of its output. The p-value for this test will be: A 0.029 B 0.971 C 0.029 or 0.972 , depending on whether the test is a left-tail or a right-tail test. D 0.058
(Short Answer)
4.7/5 (37)
In testing the hypotheses: H0 : = 140
H1 : 140,
Suppose that we rejected the null hypothesis at = 0.10. Then for which of the following ? values do we also reject the null hypothesis? A 0.025 B 0.01 C 0.05 D All of these choices are correct.
(Short Answer)
4.8/5 (40)
A statistics course at a large university is taught in each semester. A student has noticed that the students in semester 1 and semester 2 are enrolled in different degrees. To investigate, the student takes a random sample of 25 students from semester 1 and 25 students from semester 2 and records their final marks (%) provided in the table below. Excel was used to generate descriptive statistics on each sample.
Assume that student final marks are normally distributed in each semester. Sample of semester 1 final marks 65 45 53 76 53 85 55 63 85 77 45 57 55 60 83 96 83 55 52 67 82 64 62 88 71 Sample of semester 2 final marks 45 40 53 58 75 46 82 54 75 59 45 54 87 77 63 81 60 56 53 65 52 65 60 65 54 Semester 1 Mean 65.48 Stan dard Error 2.679 Median 63 Mode 55 Standard Deviation 13.395 Sample Variance 179.43 Range 43 Minimum 45 Maximum 88 Sum 1637 Count 25 Semester 2 Mean 60.96 Standard Error 2.5136 Median 59 Mode 54 Standard Deviation 12.568 Sample Variance 157.96 Range 47 Minimum 40 Maximum 87 Sum 1524 Count 25 There is a rumor going around the university that students with a higher IQ are enrolled in the semester 1 statistics course because they tend to be students enrolled in the degree with the higher entrance score for university. Can it be concluded at the 5% significance level that semester 1 students have a higher average final mark than semester 2 students? Assume that the population variances are unknown and equal.
(Essay)
5.0/5 (46)
If a sample of size 25 is selected, the value of A for the probability P(tdf=n-1 A) = 0.05 is 1.708.
(True/False)
4.9/5 (40)
Which of the following statements is correct regarding the percentile points of the F-distribution? A =1/ B =1/ C =1/ D =1/
(Short Answer)
4.8/5 (36)
Videocassette recorder (VCR) tapes are designed so that users can repeatedly record new material over old material. However, after a number of re-recordings the tape begins to deteriorate. A VCR tape manufacturer is experimenting with a new technology, which hopefully will produce longer-lasting tapes. Thirty of the old-style tapes and 30 utilising the new technology were used in an experiment. The tapes were used to record and re-record programs until they began to deteriorate. The number of re-recordings is assumed to be normally distributed. It is generally accepted that the number of re-recordings should exceed 55. Any tapes that do not meet this criterion are considered to be unacceptable. The number of re-recordings were observed and shown in the accompanying table.
60 61 48 68 70 58 51 46 66 74 72 69 66 63 61 77 73 49 73 55 71 59 66 61 71 49 76 52 58 59 47 56 55 66 51 49 60 62 64 62 59 57 52 51 63 51 56 66 64 68 52 50 55 76 47 55 58 63 68 78 Estimate with 90% confidence the proportion of unacceptable old tapes, and briefly describe what this interval estimate tells you.
(Essay)
4.8/5 (34)
The upper limit of the 89.9% confidence interval for the population proportion p, given that n = 80 and = 0.40, is 0.4898.
(True/False)
4.9/5 (44)
When the necessary conditions are met, a two-tail test is being conducted to test the difference between two population proportions. If the value of the test statistic z is 1.53, then the p-value is 0.126.
(True/False)
4.8/5 (36)
Videocassette recorder (VCR) tapes are designed so that users can repeatedly record new material over old material. However, after a number of re-recordings the tape begins to deteriorate. A VCR tape manufacturer is experimenting with a new technology, which hopefully will produce longer-lasting tapes. Thirty of the old-style tapes and 30 utilising the new technology were used in an experiment. The tapes were used to record and re-record programs until they began to deteriorate. The number of re-recordings is assumed to be normally distributed. It is generally accepted that the number of re-recordings should exceed 55. Any tapes that do not meet this criterion are considered to be unacceptable. The number of re-recordings were observed and shown in the accompanying table.
60 61 48 68 70 58 51 46 66 74 72 69 66 63 61 77 73 49 73 55 71 59 66 61 71 49 76 52 58 59 47 56 55 66 51 49 60 62 64 62 59 57 52 51 63 51 56 66 64 68 52 50 55 76 47 55 58 63 68 78 a. Do the data allow us to infer at the 10% significance level that the proportion of unacceptable new tapes is less than 20%?
b. Can we infer at the 10% significance level that the variance of the number of re-recordings of the new tape is less than 100?
(Essay)
5.0/5 (31)
Which of the following is a required condition for using the normal approximation to the binomial in constructing interval estimate for the difference between two population proportions? 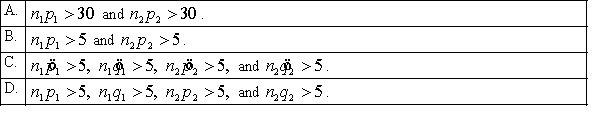
(Short Answer)
4.7/5 (41)
If a sample has 25 observations and a 99% confidence estimate for is needed, the appropriate t-score is 2.797.
(True/False)
4.9/5 (33)
When the necessary conditions are met, a two-tail test is being conducted at = 0.10 to test H0: = 1. The two sample variances are = 736 and = 1024, and the sample sizes are n1 = 16 and n2 = 25. The rejection region is F > 2.11 or F < 0.4367.
(True/False)
4.9/5 (42)
A statistics course at a large university is taught in each semester. A student has noticed that the students in semester 1 and semester 2 are enrolled in different degrees. To investigate, the student takes a random sample of 25 students from semester 1 and 25 students from semester 2 and records their final marks (%) provided in the table below. Excel was used to generate descriptive statistics on each sample.
Assume that student final marks are normally distributed in each semester. Sample of semester 1 final marks 65 45 53 76 53 85 55 63 85 77 45 57 55 60 83 96 83 55 52 67 82 64 62 88 71 Sample of semester 2 final marks 45 40 53 58 75 46 82 54 75 59 45 54 87 77 63 81 60 56 53 65 52 65 60 65 54 Semester 1 Mean 65.48 Stan dard Error 2.679 Median 63 Mode 55 Standard Deviation 13.395 Sample Variance 179.43 Range 43 Minimum 45 Maximum 88 Sum 1637 Count 25 Semester 2 Mean 60.96 Standard Error 2.5136 Median 59 Mode 54 Standard Deviation 12.568 Sample Variance 157.96 Range 47 Minimum 40 Maximum 87 Sum 1524 Count 25 (a) Can we conclude at the 5% level of significance that over 40% of students in the population scored a pass grade in semester 1, where a pass grade is 50% to 64%?
(b) Find the p-value of the test and briefly explain how to use it to test the hypotheses.
(Essay)
4.9/5 (26)
For a sample of 25 observations taken from a normally distributed population with standard deviation of 6, a 95% confidence interval estimate for the population mean would require the use of: A t=2.064 B t=1.711 C =39.3641 D z=1.96
(Short Answer)
4.8/5 (33)
In a hypothesis test for the population variance, the hypotheses are: . . If the sample size is 15 and the test is being carried out at the 5% level of significance, the null hypothesis will be rejected if: A <6.5706 B >24.9958 C <7.2609 D >23.6848
(Short Answer)
4.9/5 (39)
Filters
- Essay(0)
- Multiple Choice(0)
- Short Answer(0)
- True False(0)
- Matching(0)